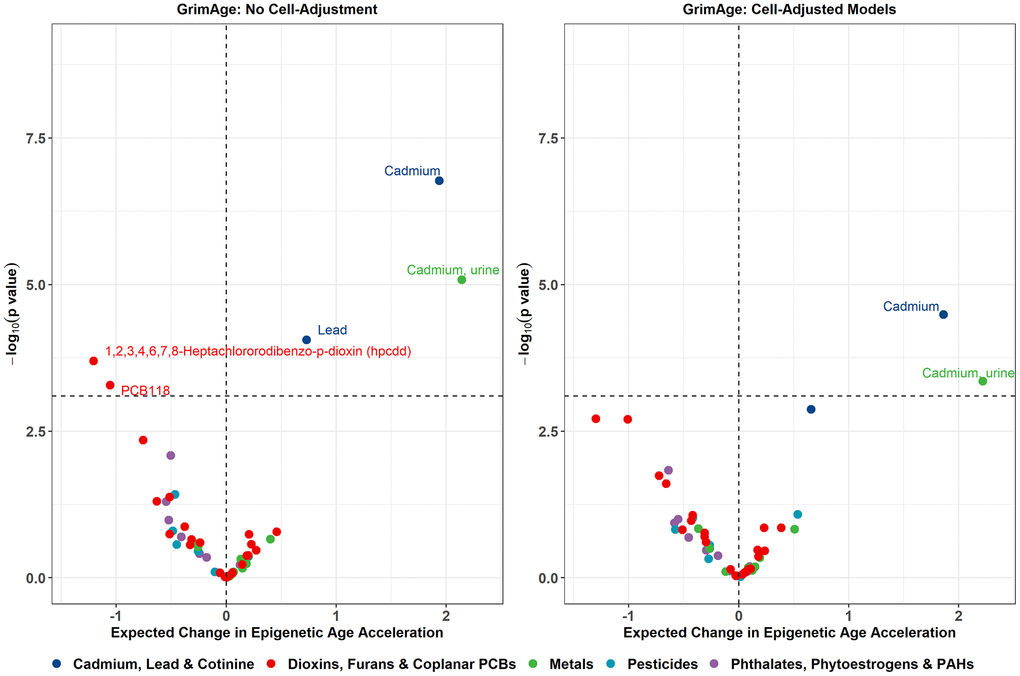
Figure 3.Volcano plots displaying the expected change in GrimAge acceleration for a 1 SD increase in log2-transformed exposure on the X-axis, and -log10 p-values on the Y-axis from the sensitivity models adjusting for cotinine exposure. Color corresponds to the broad category of exposure. Volcano plots for remaining epigenetic clocks are presented in Supplementary Figure 4.
Figure 3 — Exposome-wide association study of environmental chemical exposures and epigenetic aging in the national health and nutrition examination survey | Aging