Submit an Article
Navigate
Home
Editorial Board
Editorial Policies
Current Volume
Archive
Scientific Integrity
Publication Ethics Statements
Interviews with Outstanding Authors
Newsroom
Sponsored Conferences
Podcast
Contact
Special Collections
Submit an Article
Online ISSN: 1945-4589
Research Paper
|
Volume 17, Issue 2
|
pp. 408–430
Exposome-wide association study of environmental chemical exposures and epigenetic aging in the national health and nutrition examination survey
Back to article
Figure 1
(1 of 3)
−
100%
+
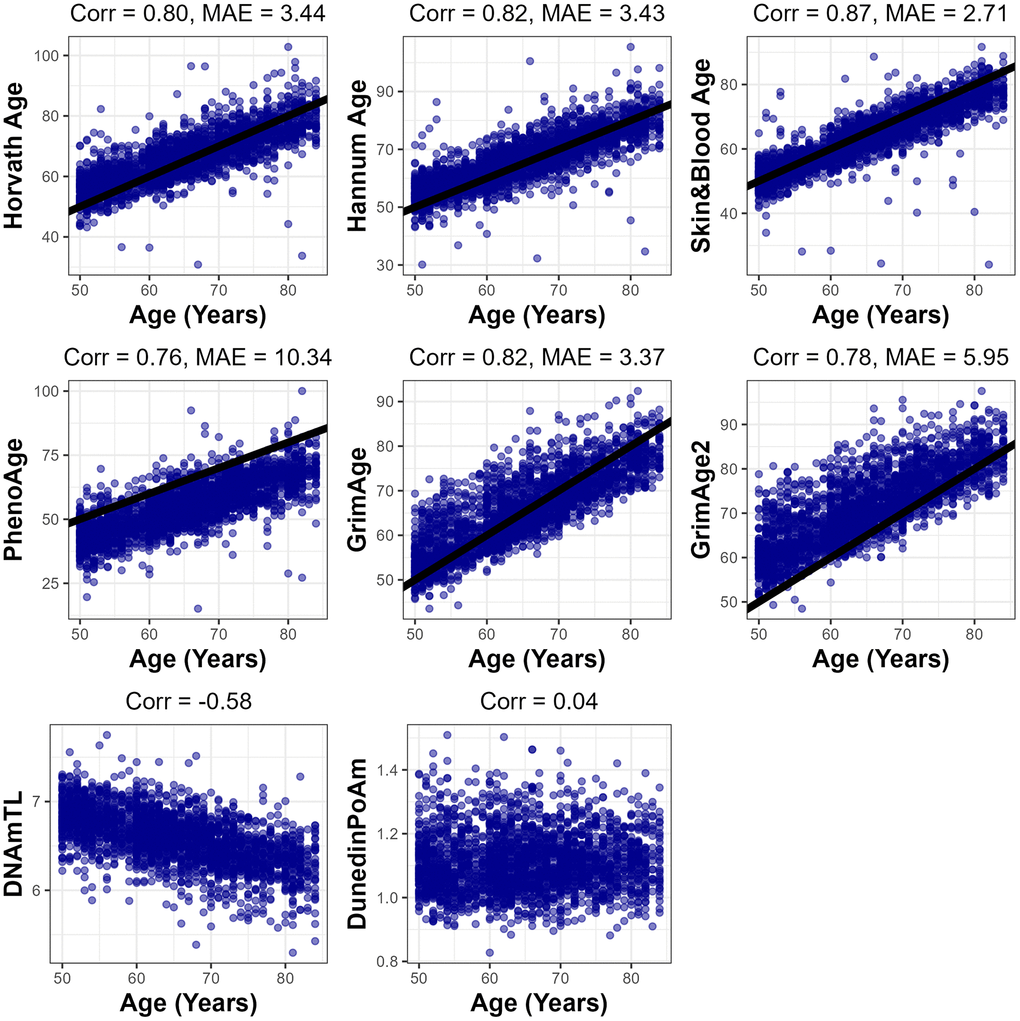
Figure 1.
Fit between each epigenetic clock predictions and chronological age.
Pearson correlation (Corr.) and median absolute error (MAE) presented for each clock which has years for units. 1-to-1 line shown in black for main clocks.