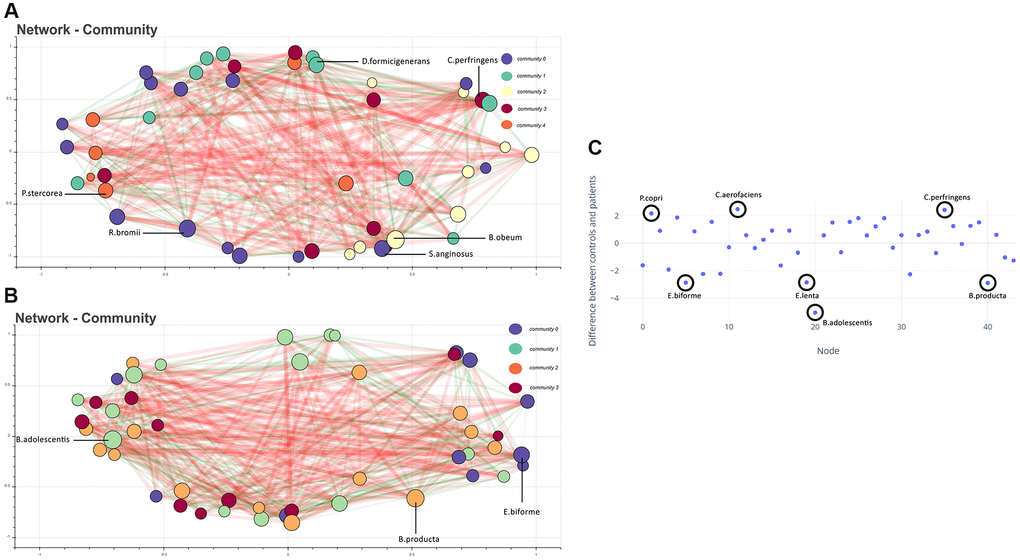
Figure 2. (A) Co-occurrence network showing bacteria (with total abundance >10) in the control group. Each node represents a bacteria, and the color represents the community it belongs to. The size of the node is proportional to the degree of the node. Edges are coloured green and red, indicating positive and negative co-occurrence, respectively. The thickness of the edge indicates the strength of the association. Representative high-degree bacteria from each community are labeled. (B) Co-occurrence network of microbes in the dementia group. (C) Difference in normalized degree centrality for each node between control and dementia networks. Positive values indicate a higher degree of centrality in the control network. Highlighted nodes correspond to outlier species.