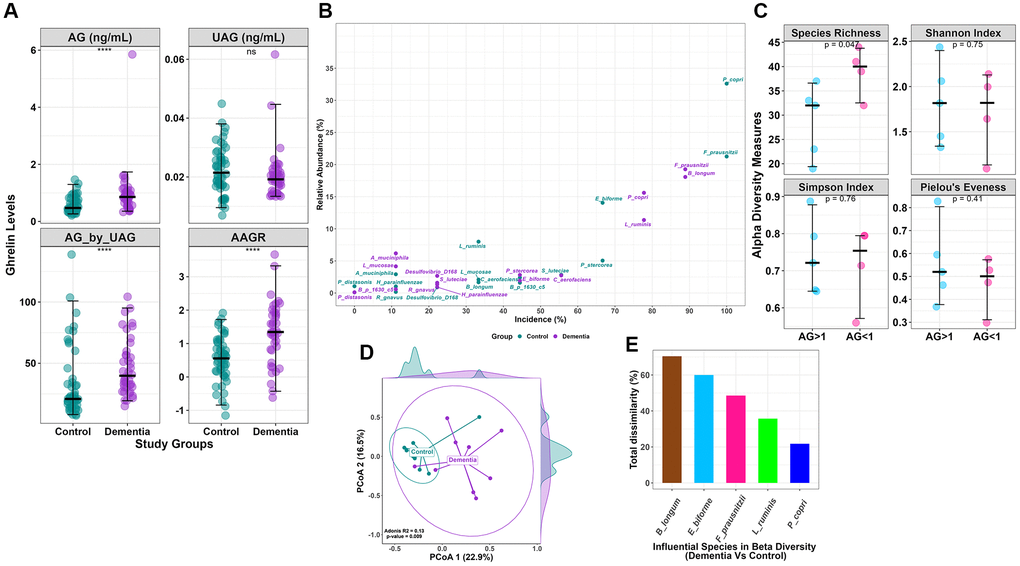
Figure 1. (A) Clinical data comparison (AG, UAG, AG/UAG, AAGR) between dementia and controls. (B) Relative abundance vs. incidence for the top 15 abundant species. Incidence refers to the number of patients in which a species is observed when its abundance is >1%. (C) Alpha diversity indices (Species Richness, Shannon Index, Simpson Index, and Pielou’s Evenness index) with statistical comparison between AG >1 and AG <1 within the dementia group. AG, Acylated Ghrelin. (D) Beta diversity using Bray-Curtis dissimilarity is plotted on the principal coordinate axis (PCoA), with density labelled on each axis to represent the variation between sample points for each group. (E) Influential species with Bray-Curtis dissimilarity (%) in beta diversity differences between the dementia and control groups.