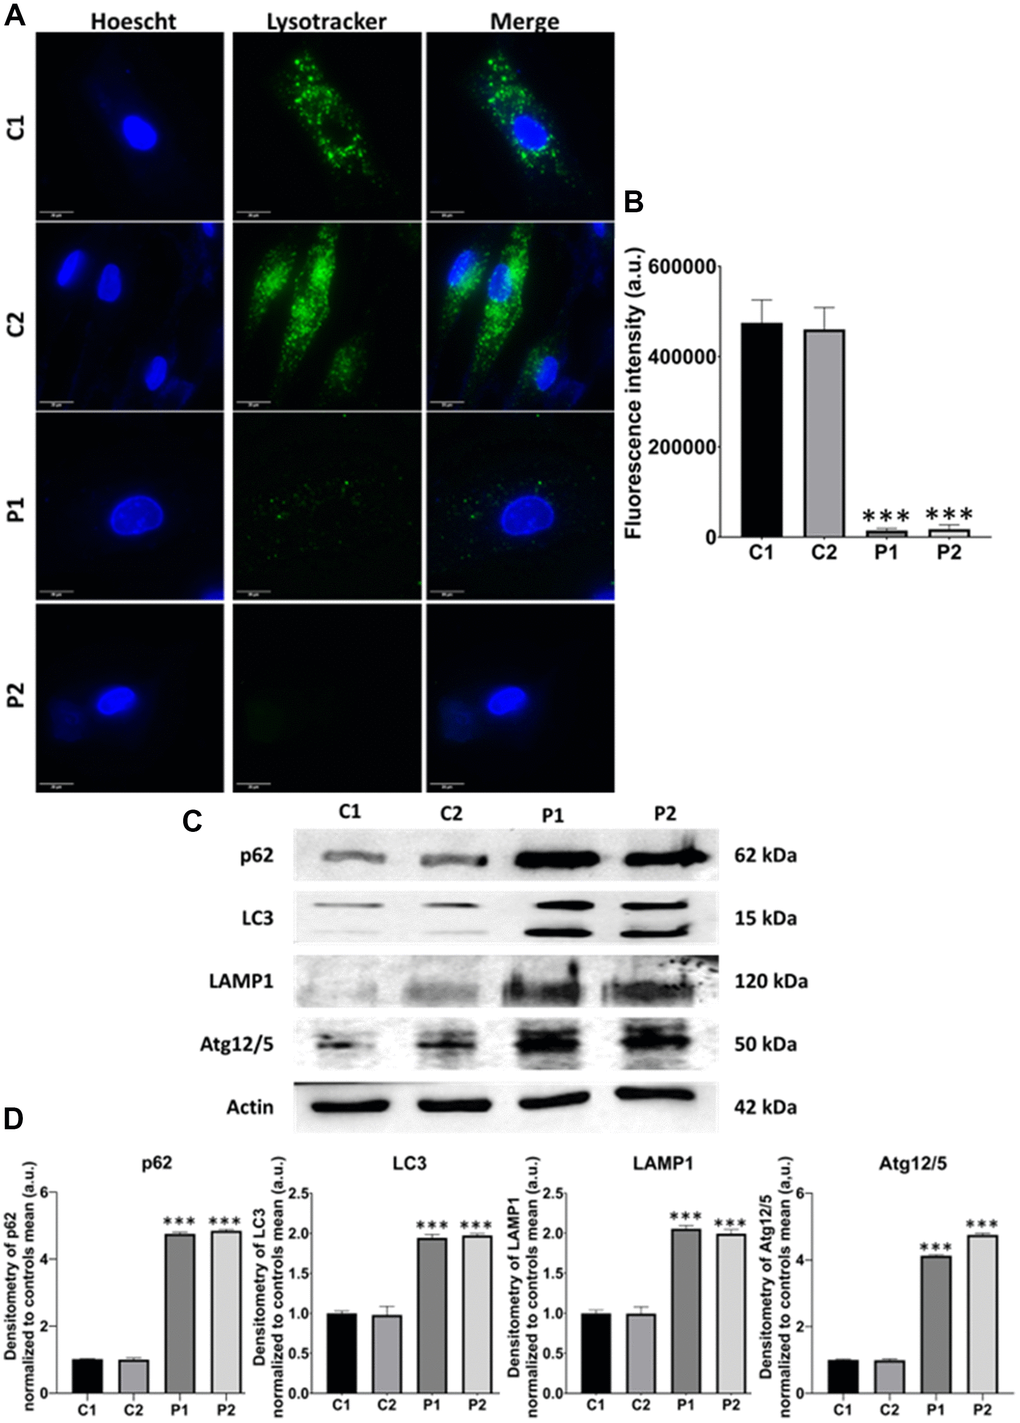
Figure 9.Evaluation of autophagy in control (C1, C2) and MS (P1, P2) cells. (A) Representative images of Lysotracker™ Green staining. Cells were stained with 75 nM Lysotracker™ Green for 1 hour. Nuclei were visualized by DAPI staining. Scale bar = 20 μm. (B) Quantification of fluorescence intensity. (C) Immunoblotting analysis of proteins related to autophagy. Actin was used as the loading control. (D) Densitometry of Western Blot data normalized to the mean of controls and referred to actin levels. Data represent the mean ± SD of three independent experiments. ***p-value < 0.0001 between control and MS cells. a.u.: arbitrary units.