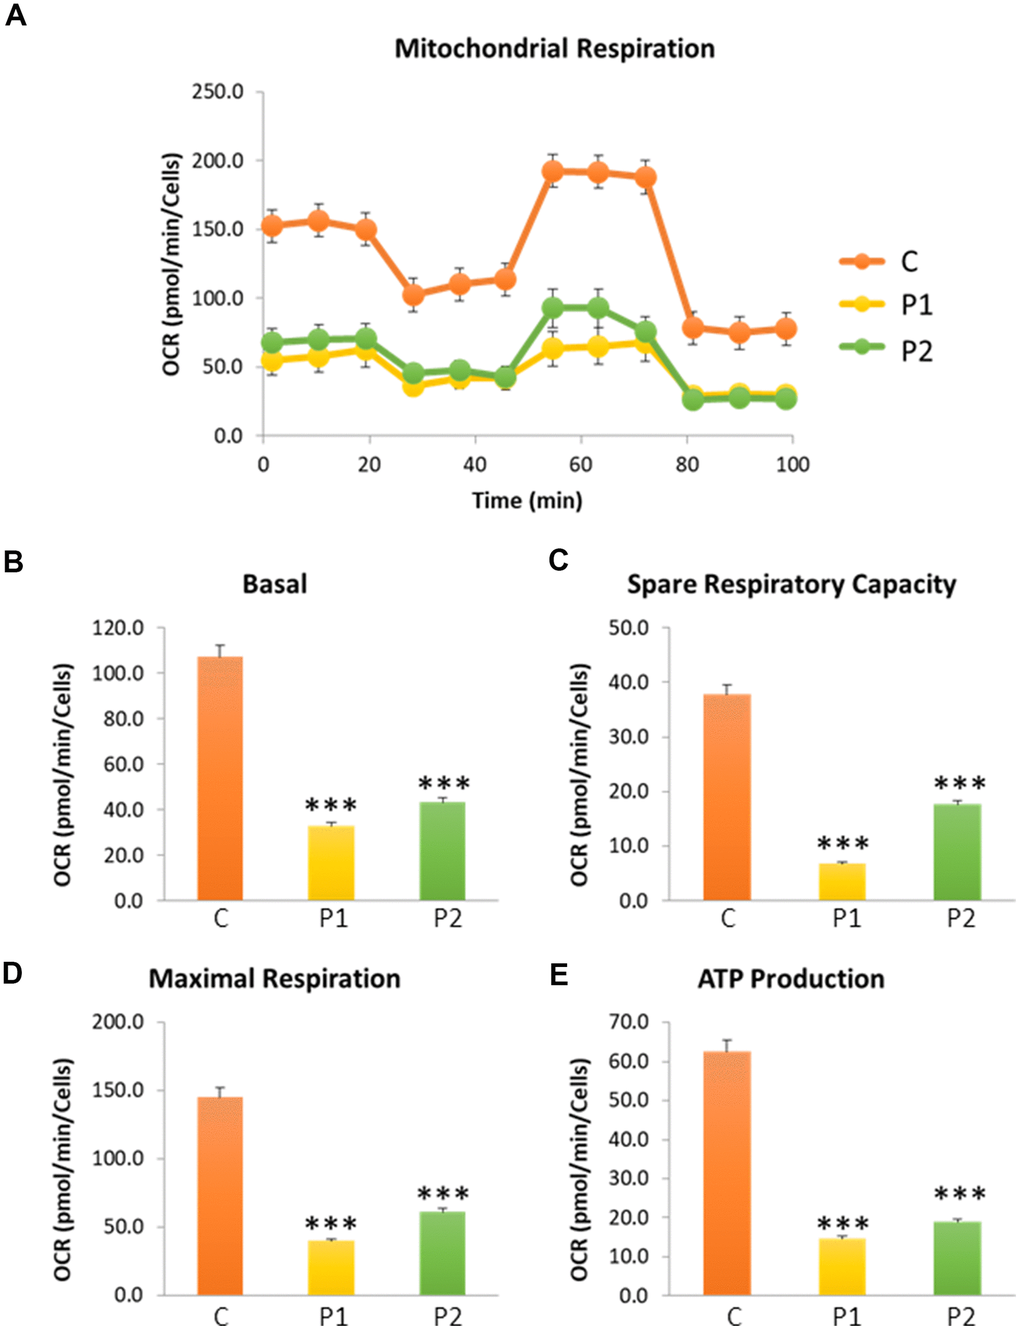
Figure 2.Cell bioenergetics in control (C) and MS (P1, P2) cells. C represents the mean of C1 and C2 data. (A) Mitochondrial respiration profile. (B) Basal respiration. (C) Spare respiratory capacity. (D) Maximal respiration. (E) ATP production. Data represent the mean ± SD of three independent experiments. ***p-value < 0.0001 between control and MS cells. OCR: oxygen consumption rate.