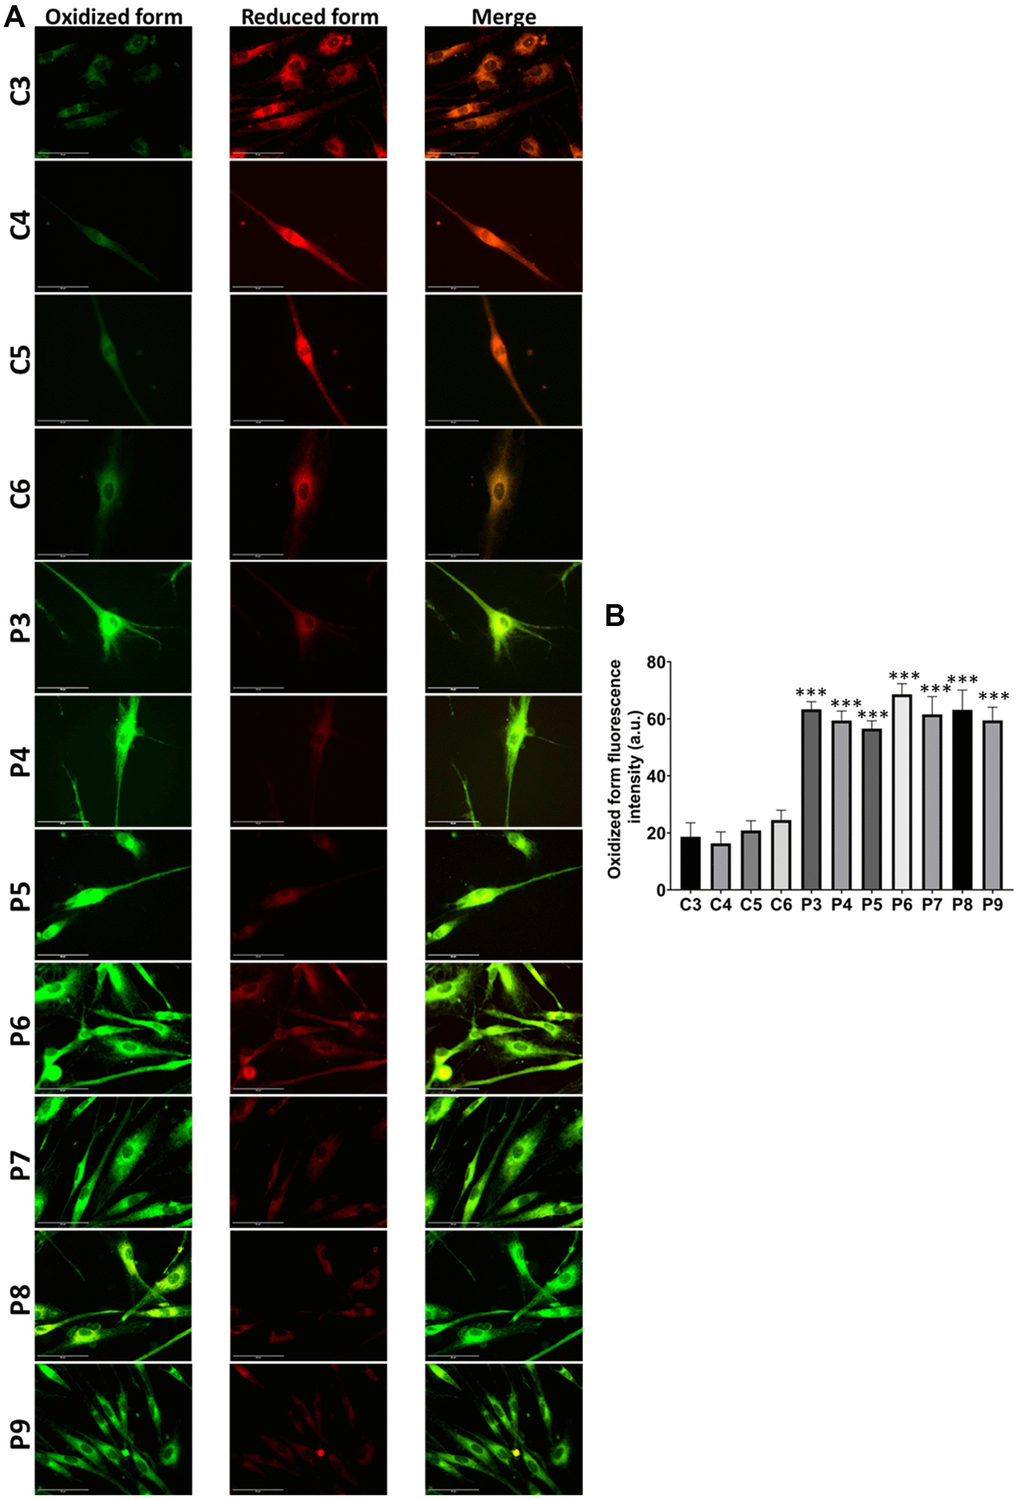
Figure 14.Lipid peroxidation in control (C3, C4, C5, C6) and MS (P3, P4, P5, P6, P7, P8, P9) cells. (A) Representative images of lipid peroxidation by BODIPY® 581/591 C11 staining. Scale bar = 20 μm. (B) Quantification of oxidized form fluorescence intensity. Data represent the mean ± SD of three independent experiments. ***p-value < 0.0001 between control and MS fibroblasts.