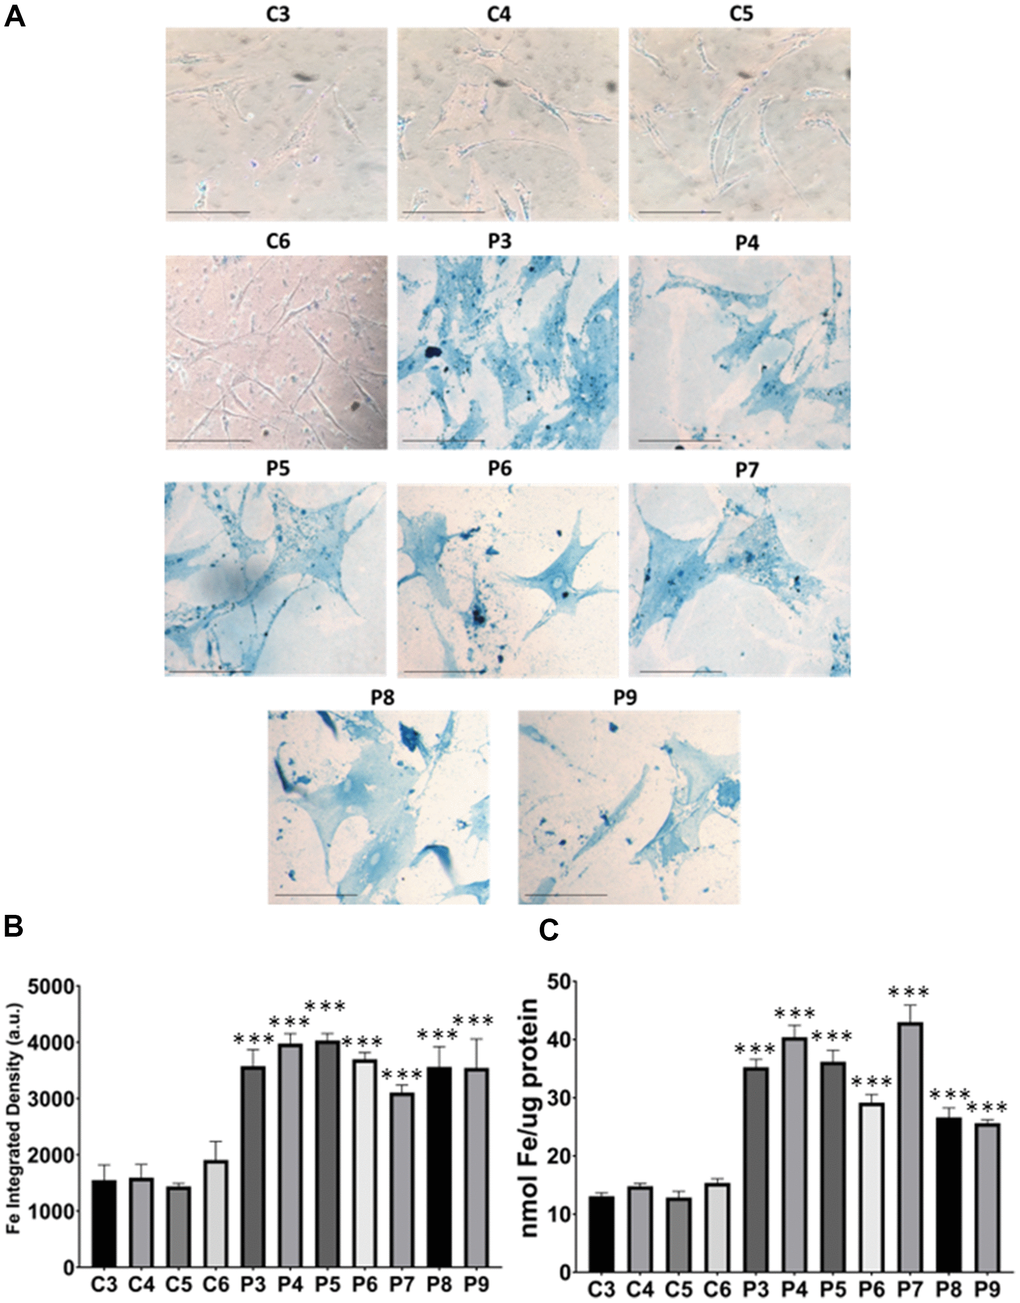
Figure 12.Iron accumulation in MS cells. (A) Representative images of Prussian Blue Staining in four control cell lines (C3, C4, C5, C6) and seven patient cell lines (P3, P4, P5, P6, P7, P8, P9). (B) Quantification of iron integrated density. (C) Iron levels determined by ICP-MS. Data represent the mean ± SD of three independent experiments. ***p-value < 0.0001 between control and patients’ cells. Scale bar = 20 μm. a.u.: arbitrary units.