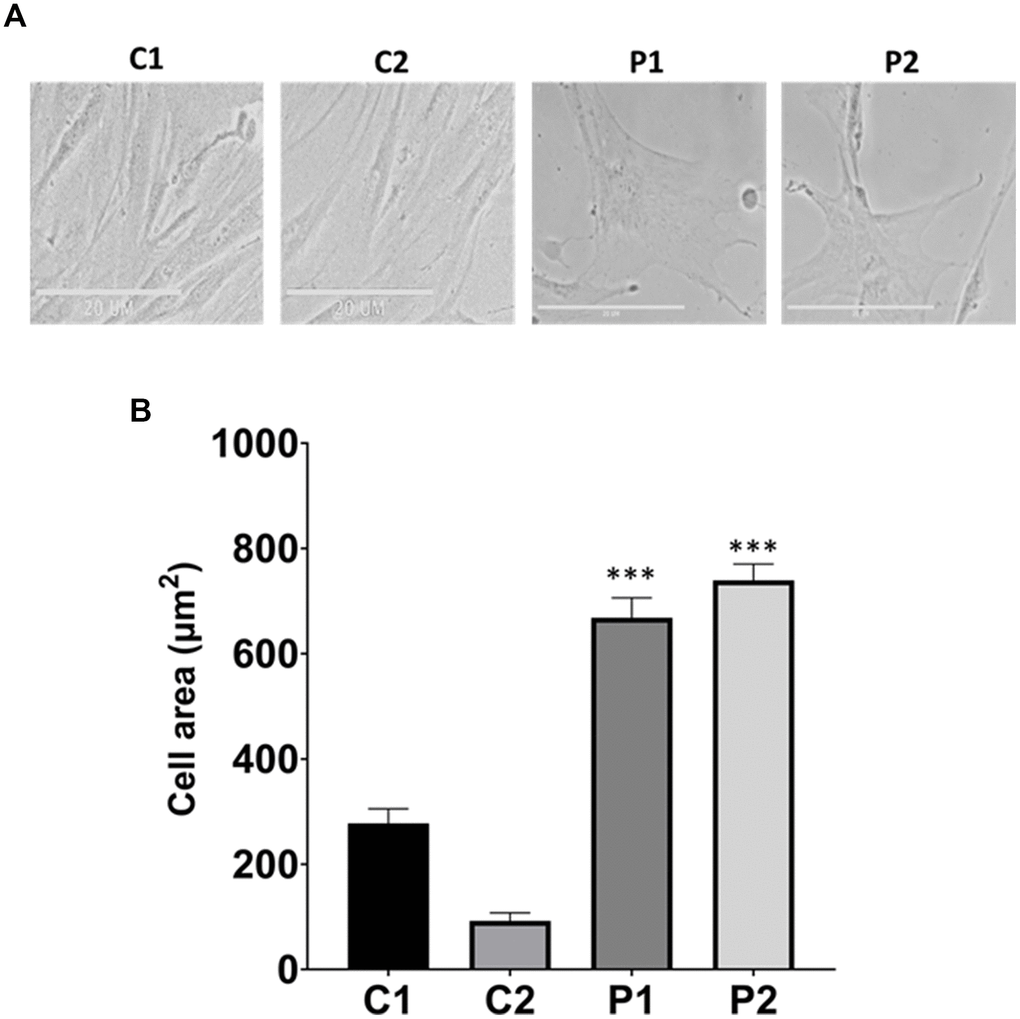
Figure 1.Analysis of cell morphology in control (C1, C2) and patients (P1, P2) fibroblasts. (A) Representative images of morphological characterization. Scale bar = 20 μm. (B) Quantification of cell area. Data represent the mean ± SD of three independent experiments. ***p-value < 0.0001 between control and MS fibroblasts.