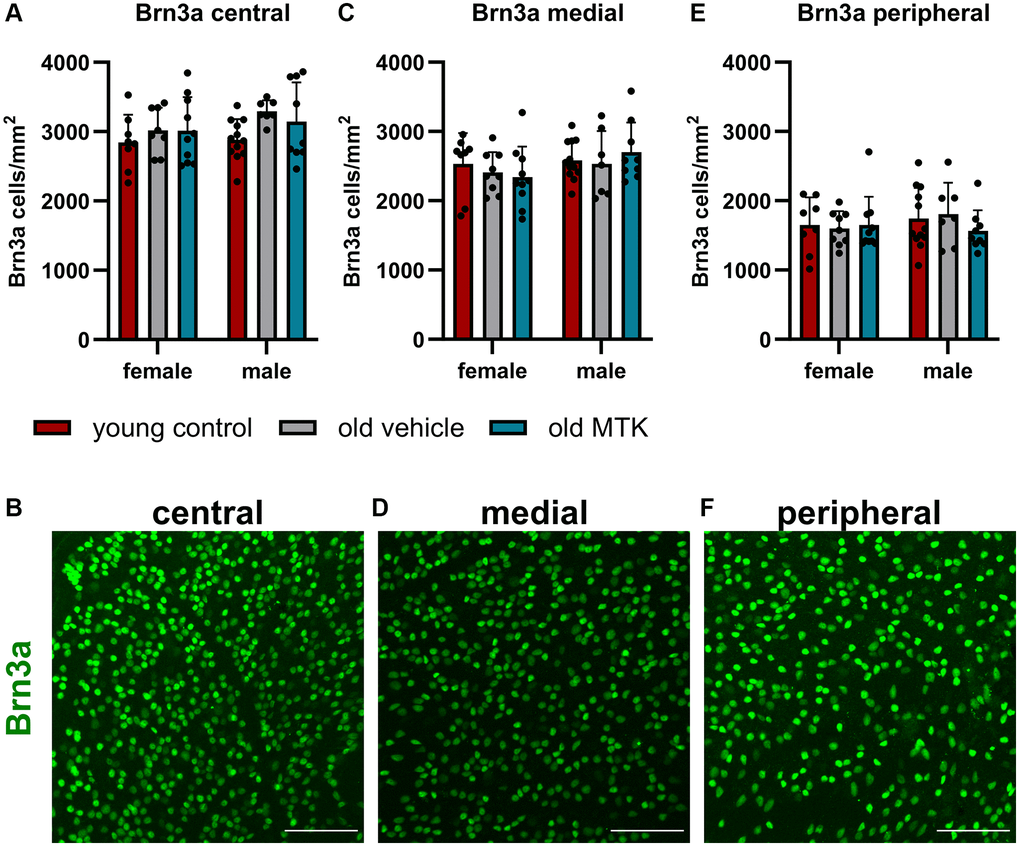
Figure 6.The RGCs were located in the central, medial and peripheral regions of the retinas of young untreated, vehicle-treated and MTK-treated old mice. RGCs were visualized by Brn3a labeling (green) and counted using ImageJ. RGC counts and representative images of Brn3a-labeled (A, B) central, (C, D) medial and (E, F) peripheral regions in the retinas of young untreated, vehicle-treated and MTK-treated old mice. Scale bar = 100 μm. The data are represented as bar graphs and scatter plots ± SDs, n = 7–11. Two-way ANOVA (main factors: group and sex) followed by a Dunnett multiple comparison test.