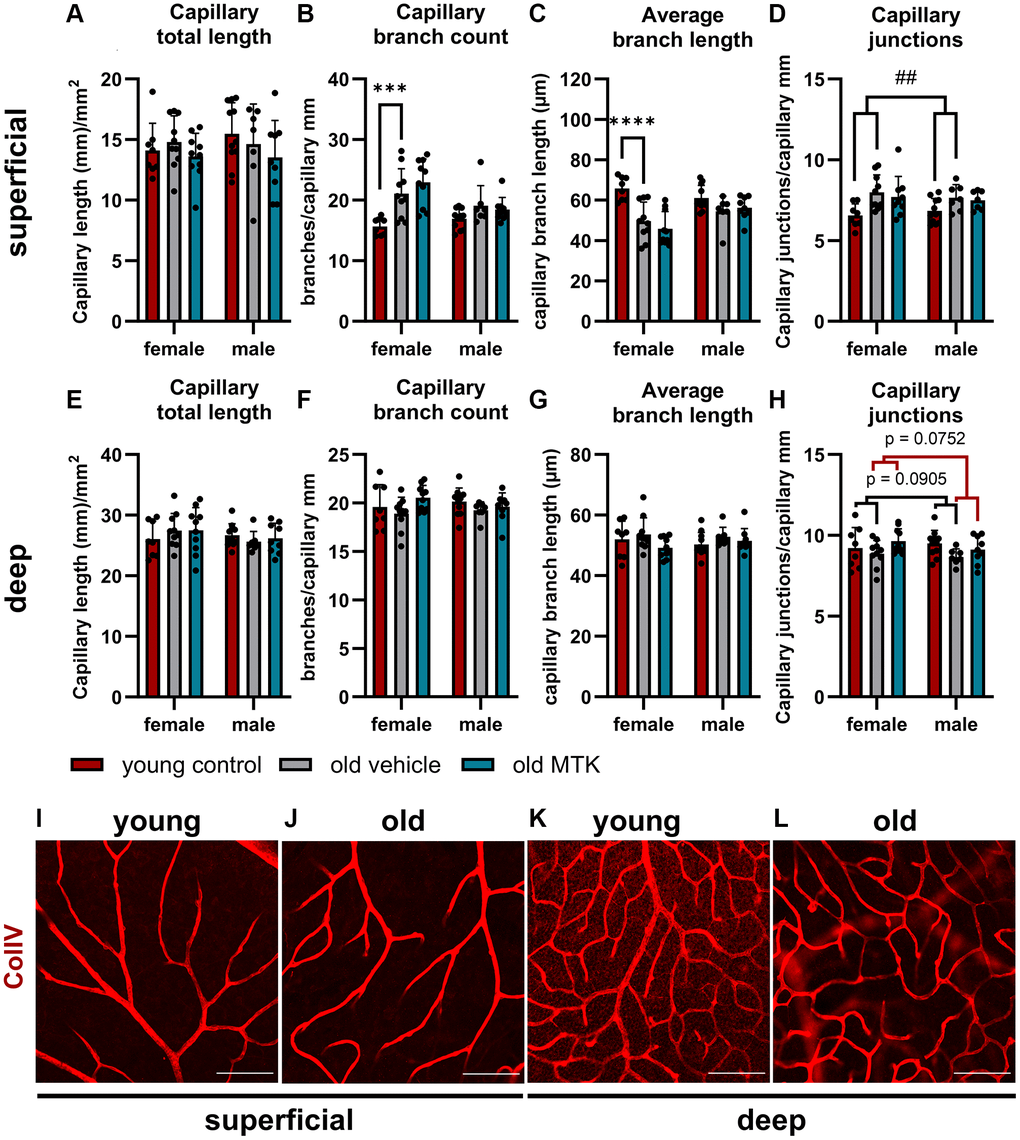
Figure 5.Capillary analysis of the superficial and deep retinal layers of young untreated, vehicle-treated and MTK-treated old mice. (A) Capillary total length, (B) branch count, (C) average branch length and (D) junctions in superficial retinal layers. (E) Capillary total length, (F) branch count, (G) average branch length and (H) junctions in deep retinal layers. Representative images of ColIV (red)-positive capillary structures in (I) young untreated and (J) old vehicle-treated superficial retinal layers and (K) young untreated and (L) old vehicle-treated deep retinal layers. Scale bar = 100 µm. The data are represented as bar graphs and scatter plots ± SDs, n = 7–11. Two-way ANOVA (main factors: group and sex) followed by a Dunnett multiple comparison test. ##p < 0.01 young control vs. old vehicle-treated; female-specific effect: ****p < 0.0001 and ***p < 0.001 young female control vs. old female vehicle-treated.