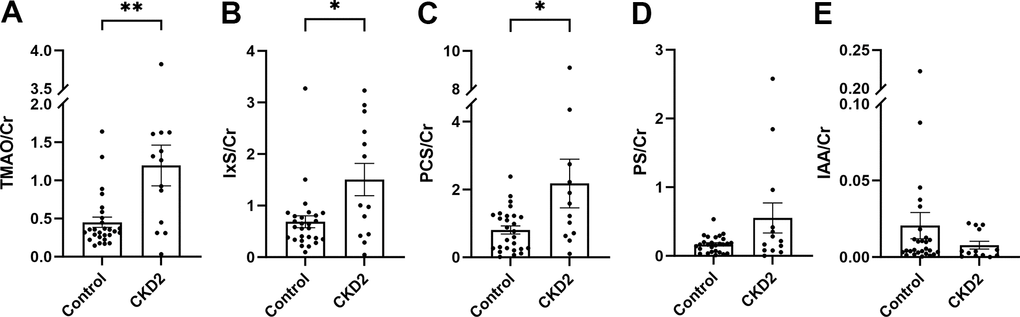
Figure 2.Urine levels of uremic toxins in cohort 1. The levels of urinary uremic toxins were normalized by creatinine (A–E). The box and bars represent mean and SEM. TMAO, trimethylamine N-oxide; IxS, indoxyl sulfate; PCS, p-cresol sulfate; PS, phenyl sulfate; IAA, indole-3-acetic acid; Cr, creatinine; CKD2, CKD stage 2. Asterisks (*) denote P-values from the Mann-Whitney test, *P<0.05, **P<0.01.