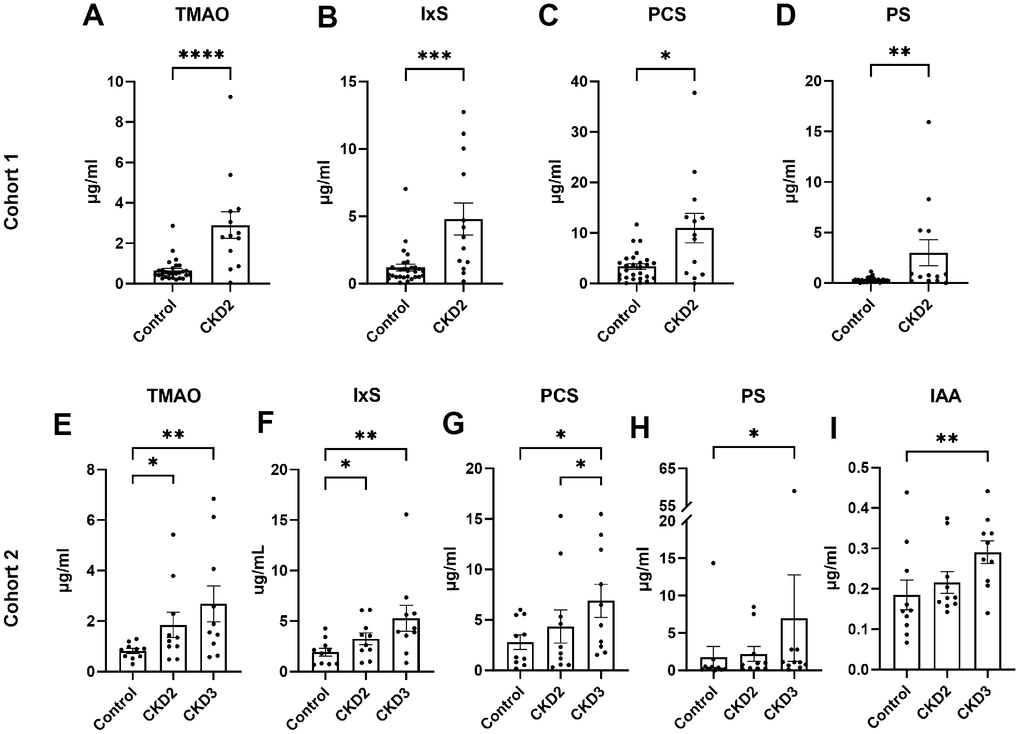
Figure 1.Serum concentrations of uremic toxins. The concentrations of uremic toxins were quantified in cohort 1 (A–D) and cohort 2 (E–I). Asterisks (*) indicate statistical significance from (A–D) Mann-Whitney test and (E–M) Dunn’s multiple comparisons test: *P<0.05, ** P<0.01, *** P<0.001, **** P<0.0001. The box and bars represent mean and SEM. TMAO, trimethylamine N-oxide; IxS, indoxyl sulfate; PCS, p-cresol sulfate; PS, phenyl sulfate; IAA, indole-3-acetic acid; CKD2, CKD stage 2; CKD3, CKD stage 3.