Submit an Article
Navigate
Home
Editorial Board
Editorial Policies
Current Volume
Archive
Scientific Integrity
Publication Ethics Statements
Interviews with Outstanding Authors
Newsroom
Sponsored Conferences
Podcast
Contact
Special Collections
Submit an Article
Online ISSN: 1945-4589
Research Paper
|
Volume 16, Issue 22
|
pp. 13505–13525
When do the pathological signs become evident? Study of human mesenchymal stem cells in MDPL syndrome
Back to article
Figure 6
(6 of 8)
−
100%
+
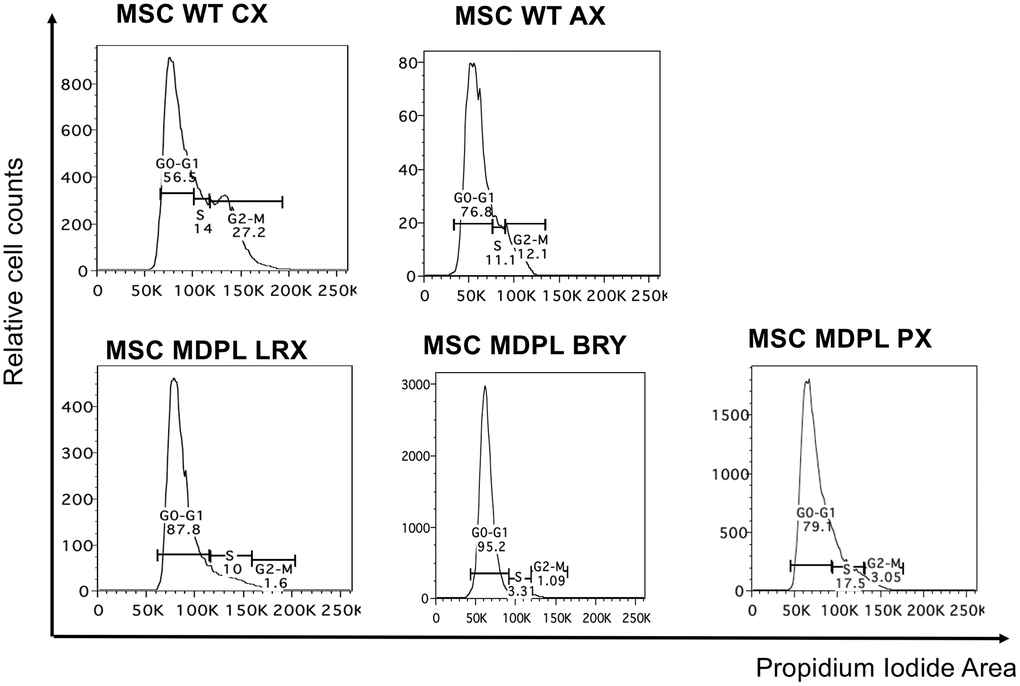
Figure 6.
Cell cycle analysis.
Histogram plots showing cells in G0/G1, S and G2/M phases of the cell cycle performed with the DNA intercalating dye propidium iodide.