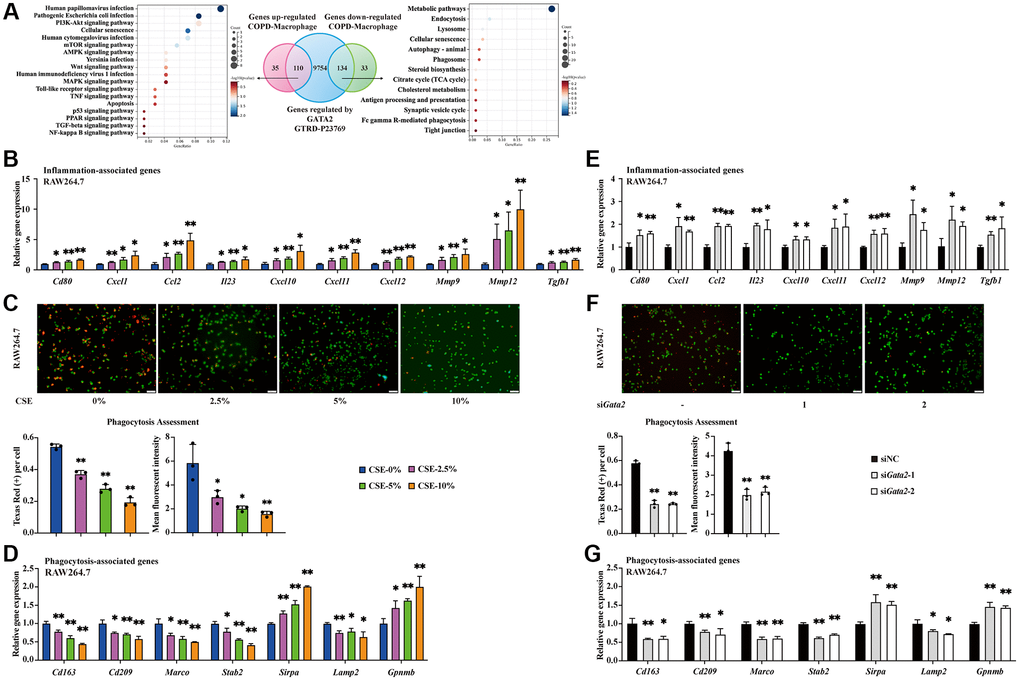
Figure 2.Downregulation of GATA2 leads to pro-inflammatory phenotype and impaired phagocytosis in macrophage. Differentially expressed genes from lung macrophages in COPD patients were intersected with GTRD database GATA2 ChIP-seq measurements and the genes were subjected to KEGG pathway analysis (A). mRNA levels of Cd80, Cxcl1, Ccl2, Il23, Cxcl10, Cxcl11, Cxcl12, Mmp9, Mmp12, and Tgfb1 were measured by qPCR (B) in CSE-treated RAW264.7 cells from each group. Phagocytosis assessment in RAW 264.7 cells was done by Cell Meter™ Fluorimetric Phagocytosis Assay Kit. The images were taken using fluorescence microscopy and the average number of engulfed beads within every cell and the mean fluorescent intensity of Texas Red were calculated (C). Scale bars = 50 μm. mRNA levels of Cd163, Cd209, Marco, Stab2, Sirpa, Lamp2, and Gpnmb were measured by qPCR (D) in CSE-treated RAW264.7 cells from each group (CSE-0%, blue bars; CSE-2.5%, magenta bars; CSE-5%, green bars; CSE-10%, orange bars). *P < 0.05 or **P < 0.01 vs. CSE-0%. mRNA levels of Cd80, Cxcl1, Ccl2, Il23, Cxcl10, Cxcl11, Cxcl12, Mmp9, Mmp12 and Tgfb1 were measured by qPCR (E) in RAW264.7 cells from each group. Examination of phagocytosis was done by Cell Meter™ Fluorimetric Phagocytosis Assay Kit (F). Scale bars = 50 μm. mRNA levels of Cd163, Cd209, Marco, Stab2, Sirpa, Lamp2, and Gpnmb were measured by qPCR (G) in RAW264.7 cells from each group (siNC, black bars; siGata2-1, gray bars; siGata2-2, white bars). *P < 0.05 or **P < 0.01 vs. siNC.