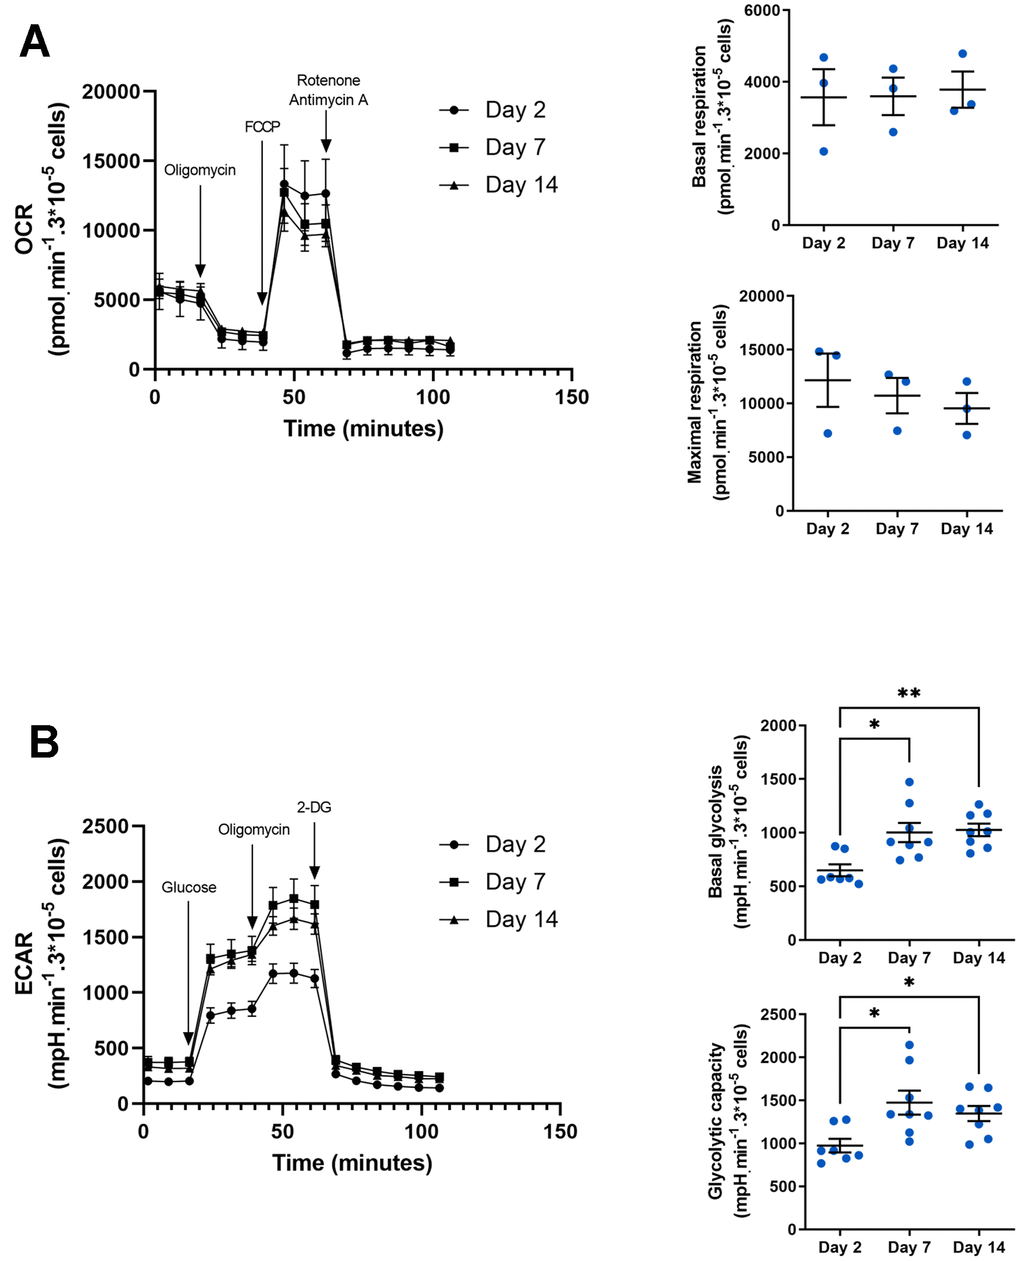
Figure 4.Metabolic phenotype in aged macrophages in vitro. (A) Seahorse analysis of oxygen consumption rate (OCR), basal and maximal respiration. Results are normalized by cell count using DAPI staining (n=3). (B) Seahorse analysis of extracellular acidification rate (ECAR), basal glycolysis and glycolytic capacity. Results are normalized by cell count using DAPI staining (n=8). Error bars represent the mean ± SEM. p-values were obtained comparing groups overtime using a non-parametric one-way ANOVA analysis (Kruskal-Wallis analysis followed by Dunnett’s multiple comparison test; *p<0.05; **p<0.01).