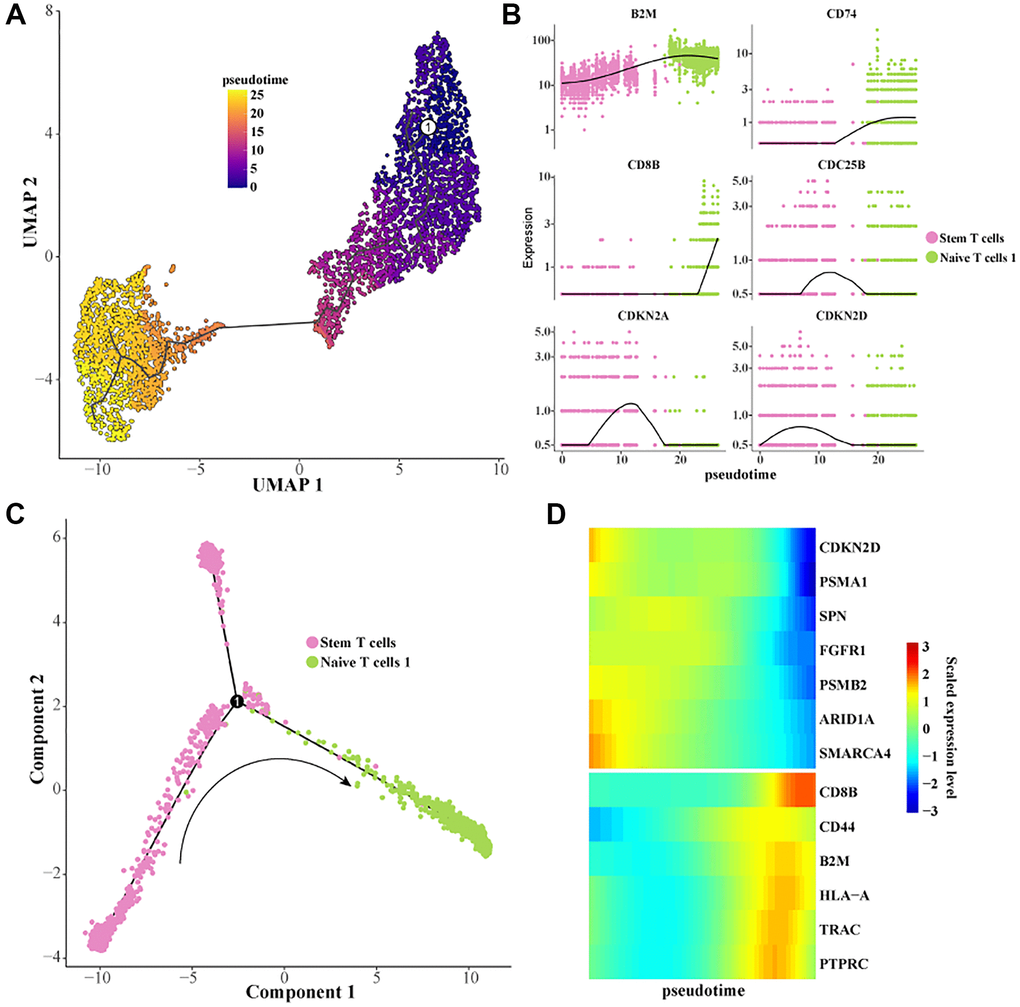
Figure 3.Construction of a differentiation trajectory from Stem T cells to Naive T cells 1. (A) Differentiation trajectory from Stem T cells to Naive T cells 1 was constructed using Monocle 3. (B) Scatterplot of the expression levels of the genes of interest as a function of pseudotime. (C) Differentiation trajectory from Stem T cells to Naive T cells 1 constructed with Monocle 2. (D) Heatmap of the expression level of the gene of interest with pseudotime.