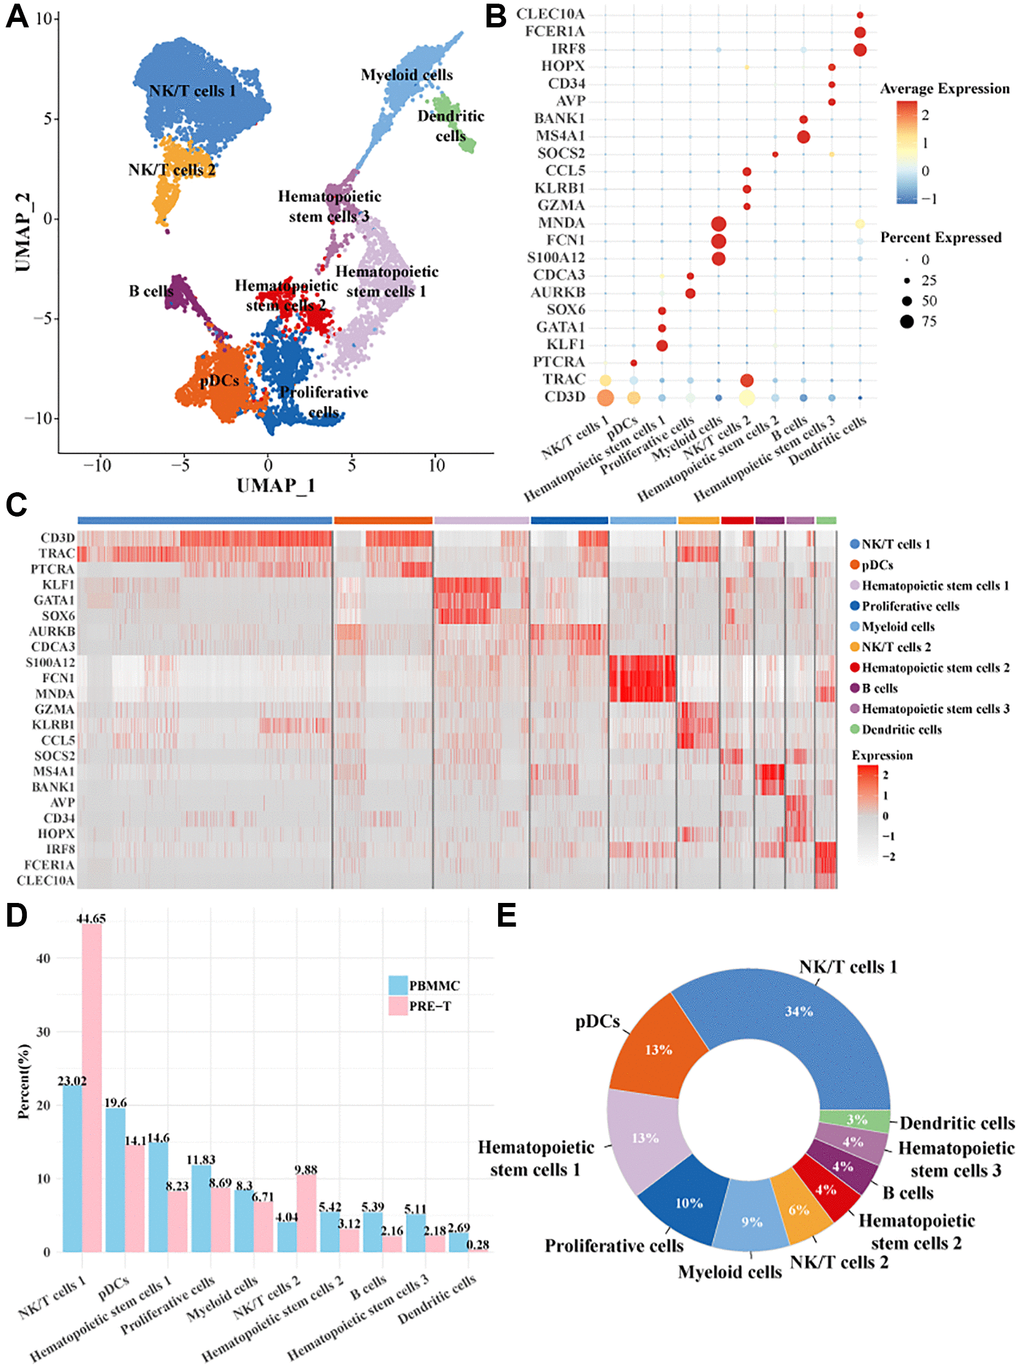
Figure 1.Single-cell mapping of pre-T childhood leukemia. (A) UMAP downscaling plot for clustering and annotation of pre-T leukemia and healthy control bone marrow mononuclear cells. (B) Bubble plots of marker gene expression profiles used for cell subpopulations. (C) Heatmap of marker gene expression profiles used to annotate cell subpopulations. (D) Proportion of each cell subpopulation between the two groups. (E) Proportion of each cell subpopulation within all cells.