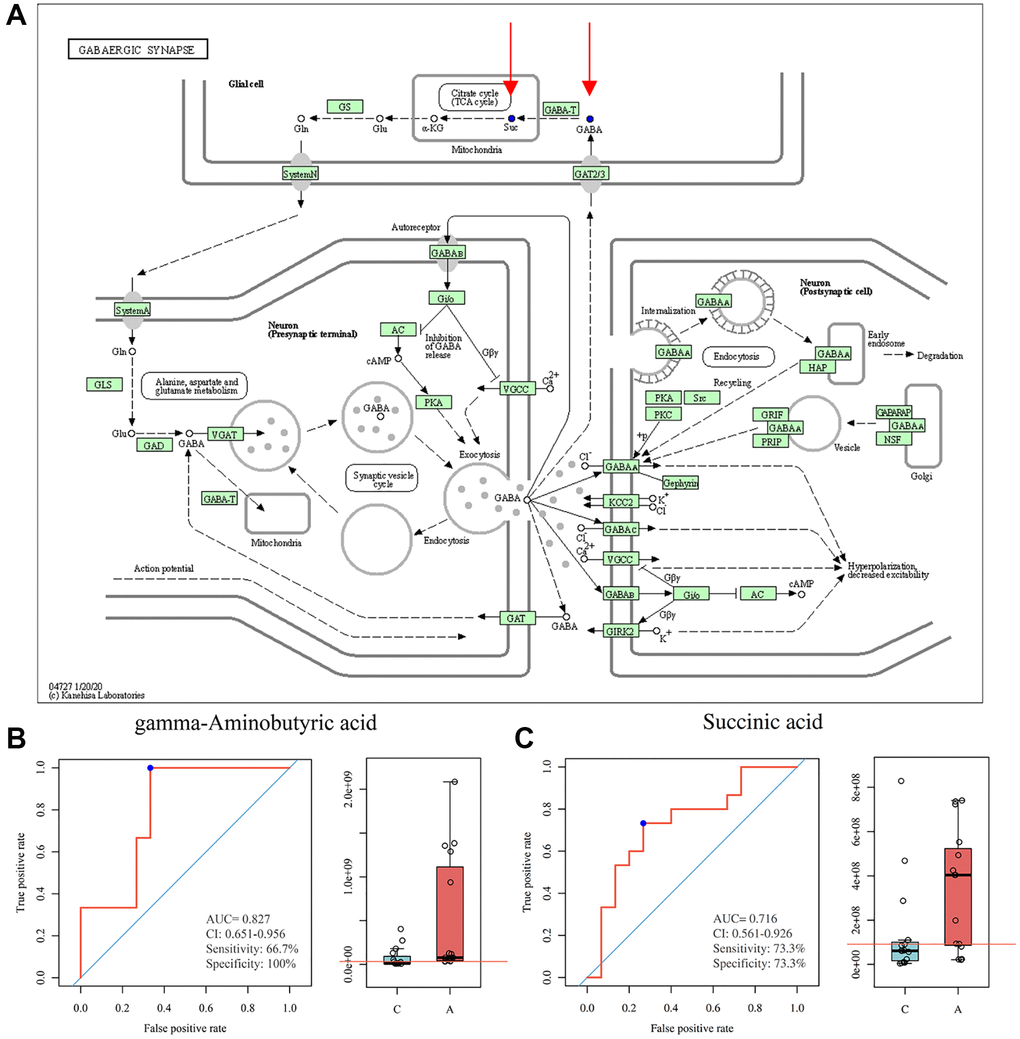
Figure 5.GABAergic synapse pathway model and ROC curve analysis. (A) KEGG pathway for GABAergic synapse, blue dots represent down-regulated metabolites (https://www.genome.jp/kegg/); (B) ROC curve analysis for GABA; (C) ROC curve analysis for succinic acid.