Submit an Article
Navigate
Home
Editorial Board
Editorial Policies
Current Volume
Archive
Scientific Integrity
Publication Ethics Statements
Interviews with Outstanding Authors
Newsroom
Sponsored Conferences
Podcast
Contact
Special Collections
Submit an Article
Online ISSN: 1945-4589
Research Paper
|
Volume 16, Issue 18
|
pp. 12623–12650
Exploring the therapeutic mechanism of Yuebi decoction on nephrotic syndrome based on network pharmacology and experimental study
Back to article
Figure 5
(5 of 14)
−
100%
+
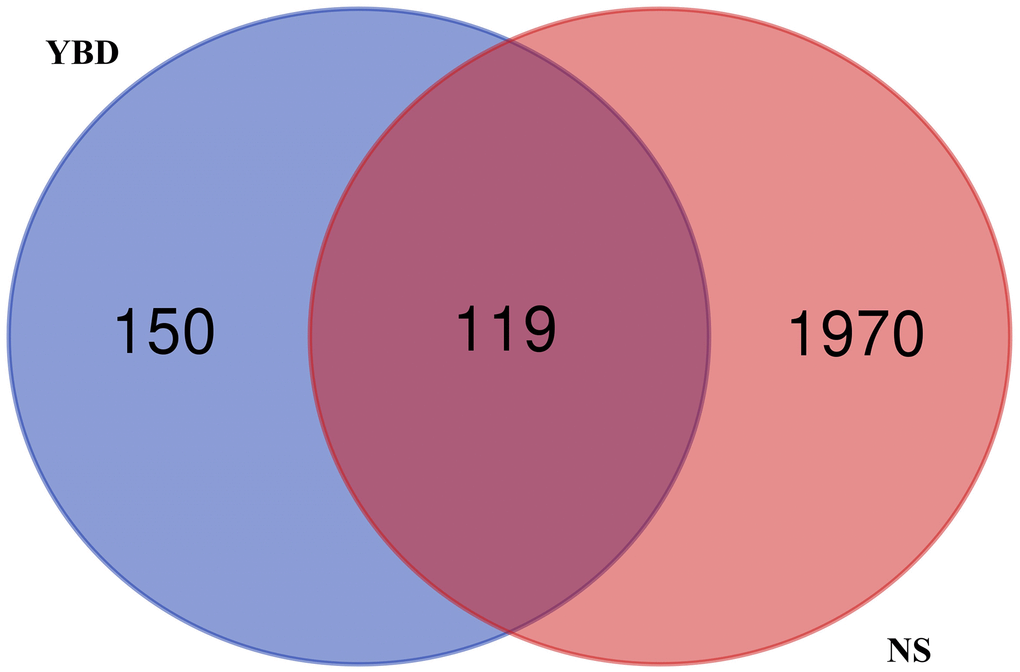
Figure 5.
Venn diagram of overlapping targets on YBD and NS.
The blue circle represented the targets of YBD, and the red circle represented the targets of NS. The part of the two intersecting circles represented the overlapping targets.