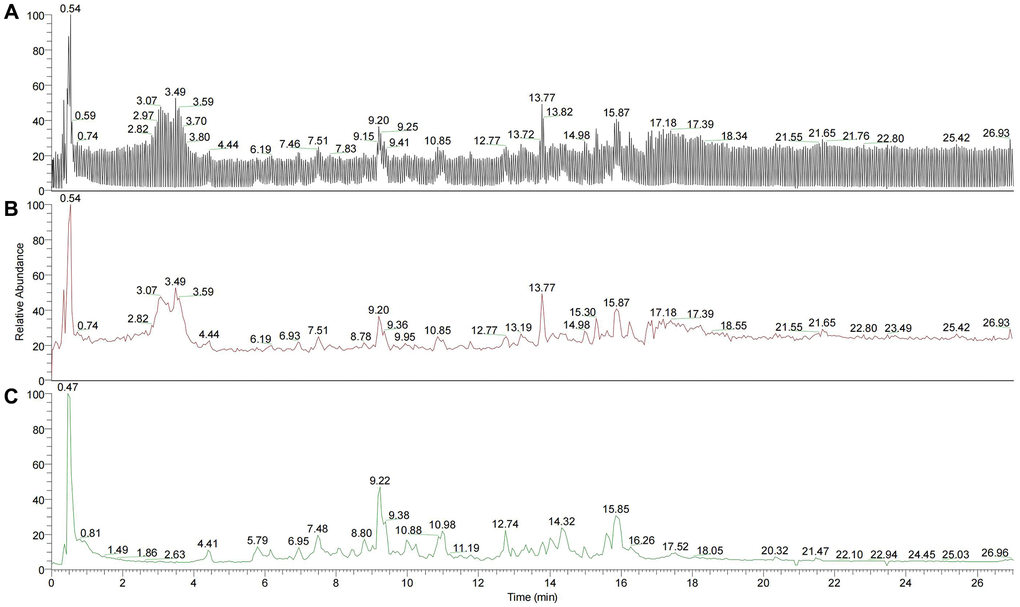
Figure 2.Total ion flow diagram of YBD. (A) Total negative and positive ion flow diagram superposition of YBD. (B) Total negative ion flow diagram of YBD. (C) Total positive ion flow diagram of YBD.
Figure 2 — Exploring the therapeutic mechanism of Yuebi decoction on nephrotic syndrome based on network pharmacology and experimental study | Aging