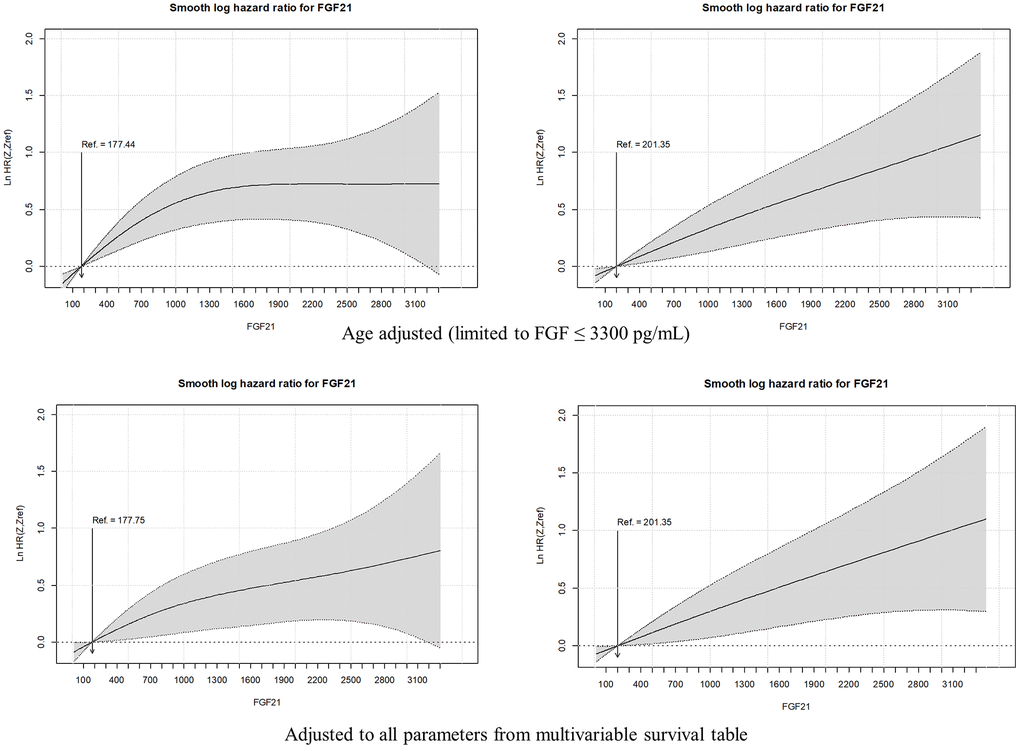
Figure 2.Smooth hazard ratios for FGF2l levels in men and women, adjusted to age and all significant factors from multivariable Cox regression analysis. The gray area indicates the 95 % confidence interval.
Figure 2 — Fibroblast growth factor 21 inversely correlates with survival in elderly population – the results of the Polsenior2 study | Aging