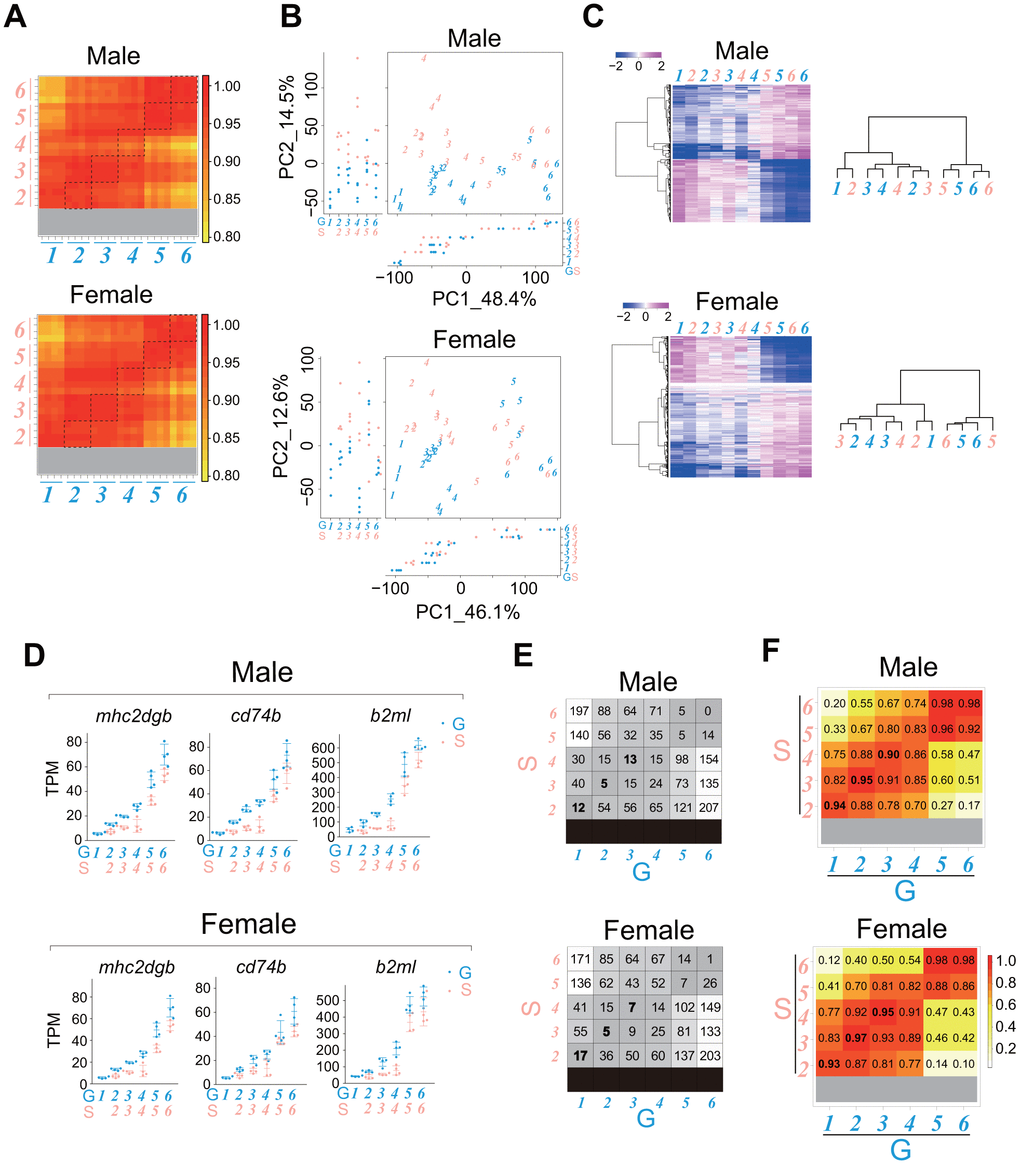
Figure 7.The rate of whole-body transcriptional change with the progression of the juvenile growth stage in single-housed fish is slightly slower than that in group-housed fish. RNA sequencing of the whole bodies of the juveniles (stages 1-6) shown in Figure 1D. The data were obtained from four samples at each stage. (A) Heatmaps showing the correlation coefficients between all samples for genes with TPM > 10 in at least one sample. The dashed squares show the correlation coefficients between group- and single-housed fish at the same growth stage. (B) PCA plots using VST values of the genes with TPM > 10 in at least one sample. Each italicized number represents an individual sample at each growth stage. Each circle represents a value of PC1/2 in an individual sample. (C) Heatmaps showing changes in the average expression at each growth stage for the common DEGs (stage 1/2 vs. stage 6) between group- and single-housed juveniles (See Venn diagrams in Supplementary Figures 5-6; males, 714 DEGs; females, 706 DEGs). The right dendrograms represent the hierarchical clustering of the samples based on the similarity of changes in expression (D) Examples of the expression of the immune response-related genes that were enriched among the common DEGs (stage 1/2 vs. stage 6) between group- and single-housed juveniles (See Venn diagrams in Supplementary Figures 5-6). The TPM values are shown. Each circle represents an individual sample. mhc2dgb, major histocompatibility complex class II DGB gene; cd74b, CD74 molecule; b2ml, beta-2-microglobulin, like. (E) Number of DEGs with > 4-fold (padj < 0.01) differences in at least one of the two-group comparisons among the genes with TPM > 50 in at least one sample. (F) Heatmaps showing the correlation coefficients between samples in genes whose expression changed substantially with body growth. (A–F) G: group-housed fish, S: single-housed fish. The blue and pink italic numbers represent the six weight-based stages of body growth in group- and single-housed fish, respectively.