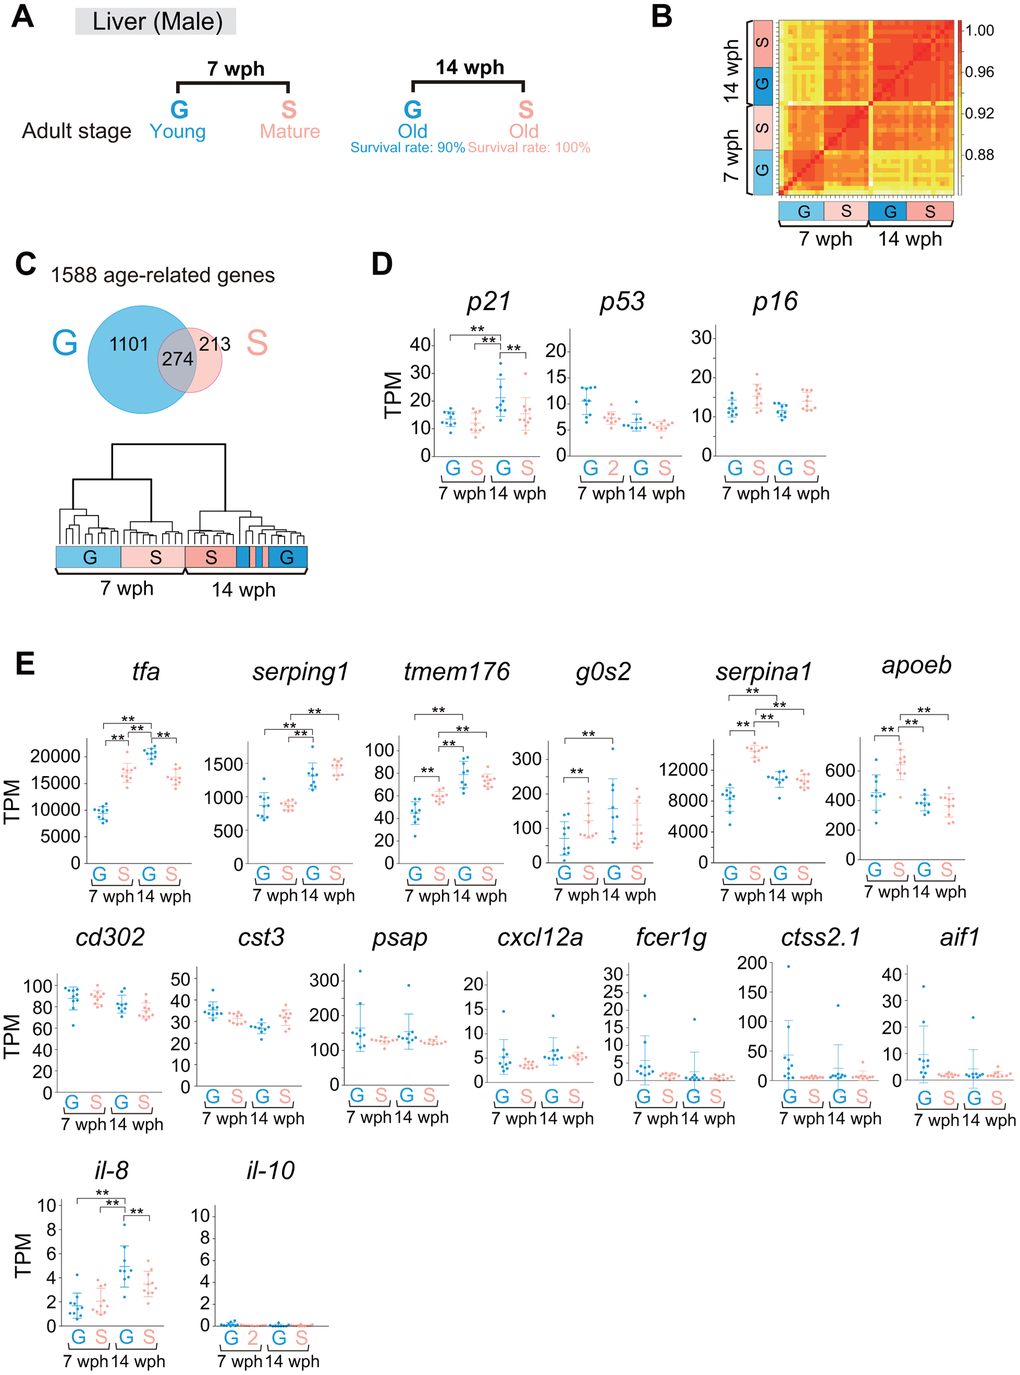
Figure 6.Comparison of liver gene expression profiles between group- and single-housed fish in early and late adulthood. (A) Schematic diagram showing the sampling for RNA sequencing of livers at 7 and 14 wph. At each age, 9-10 fish were sampled. (B) Correlation coefficients between samples in the gene sets with TPM > 10 in at least one sample. (C) The upper panel shows a Venn diagram of the DEGs (> 1.5-fold change, padj < 0.01) between 7 wph and 14 wph in either group- or single-housed fish (1588 genes). The lower panel shows hierarchical clustering of the samples based on the similarity of the changes in expression of the 1588 age-related genes. (D, E) TPM values of cell senescence markers (D) and SASP factors (E). Each circle represents an individual sample. **, padj < 0.01 by DESeq2. p21, cyclin dependent kinase inhibitor 1A; p53, tumor protein p53; p16, cyclin dependent kinase inhibitor 2A; tfa, transferrin-a; serping1, serpin family G member 1; tmem176, transmembrane protein 176; g0s2, G0/G1 switch 2; serpina1, serpin family A member 1; apoeb, apolipoprotein Eb; cd302, CD302 molecule; cst3, cystatin C; psap, prosaposin; cxcl12a, chemokine (C-X-C motif) ligand 12a; fcer1g, Fc epsilon receptor IgFc epsilon receptor Ig; ctss2.1, cathepsin S, ortholog2, tandem duplicate 1; aif1, allograft inflammatory factor 1-like; il-8, interleukin-8; il-10, interleukin-10. (A–E) G: group-housed fish, S: single-housed fish.