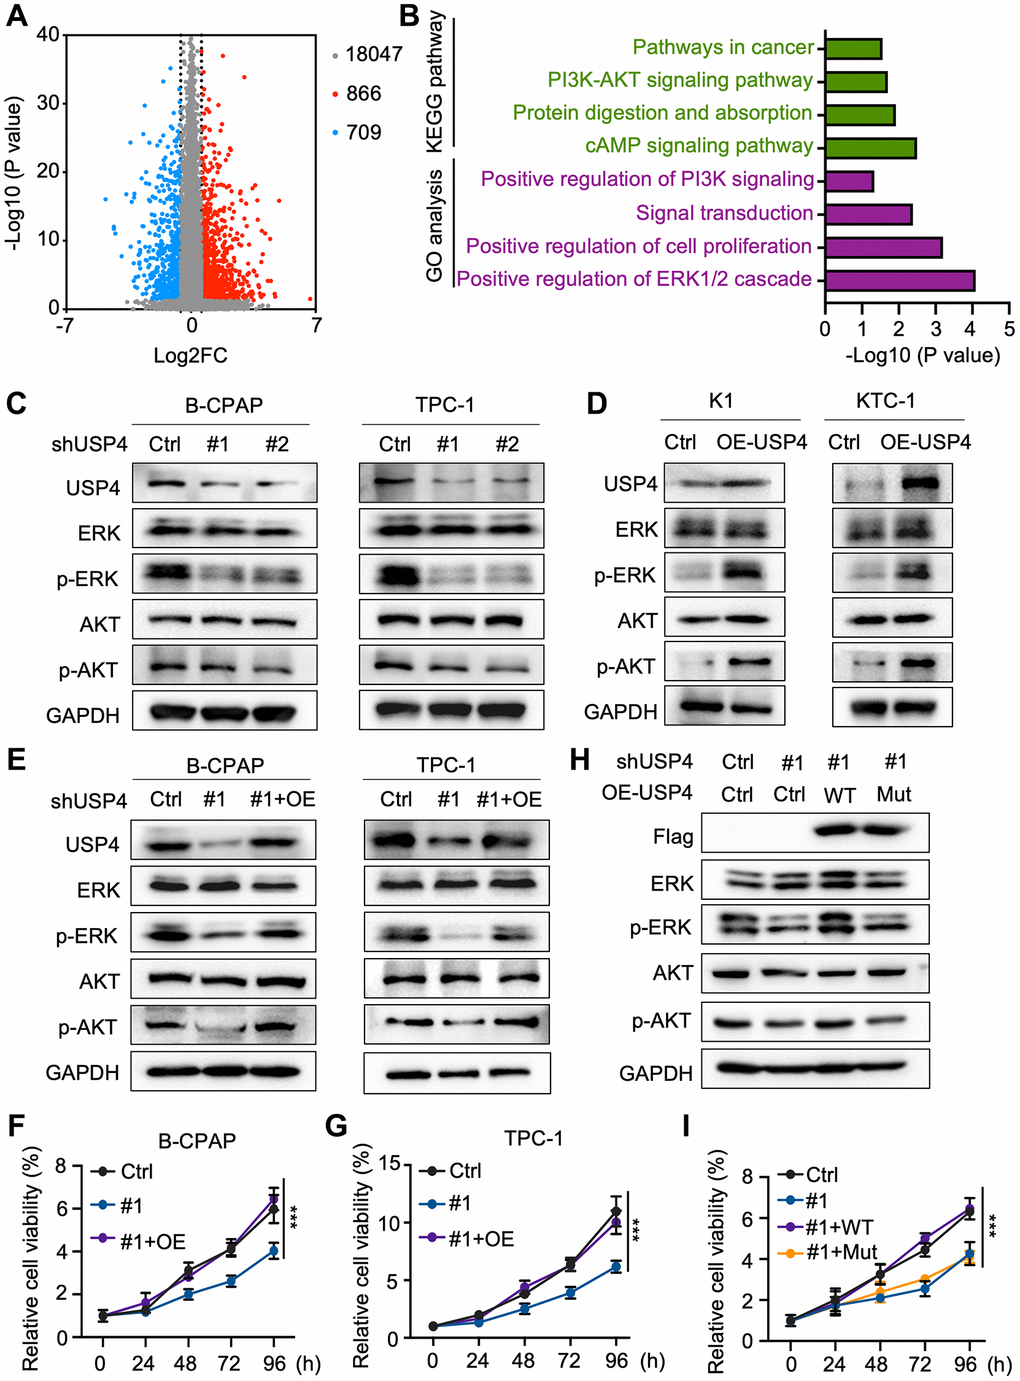
Figure 4.USP4 facilitates PTC progression via the MAPK and AKT pathways. (A) Volcano plot depicting gene expression changes in tissues with high versus low USP4 expression, generated from TCGA data; (B) Summary of significantly enriched pathways in tissues exhibiting high versus low USP4 expression; (C) Western blot analysis to evaluate changes in ERK, phosphorylated ERK, AKT, and phosphorylated AKT levels in B-CPAP and TPC-1 cells following USP4 knockdown; (D) Western blot analysis to examine changes in ERK, phosphorylated ERK, AKT, and phosphorylated AKT levels in K1 and KTC-1 cells overexpressing USP4; (E) Western blot analysis to investigate changes in ERK, phosphorylated ERK, AKT, and phosphorylated AKT levels in B-CPAP and TPC-1 cells after USP4 restoration; (F, G) CCK-8 assay to evaluate the proliferative capacity of B-CPAP and TPC-1 cells following USP4 knockdown and subsequent restoration; (H) Western blot analysis to investigate alterations in ERK, phosphorylated ERK, AKT, and phosphorylated AKT levels in USP4-knockdown cells subsequently expressing either wild-type USP4 or a deubiquitination-deficient mutant (C311A); (I) CCK-8 assay to evaluate proliferation in USP4-knockdown cells subsequently expressing either wild-type USP4 or a deubiquitination-deficient mutant (C311A). All *p < 0.05, **p < 0.01, ***p < 0.001, ****p < 0.0001.