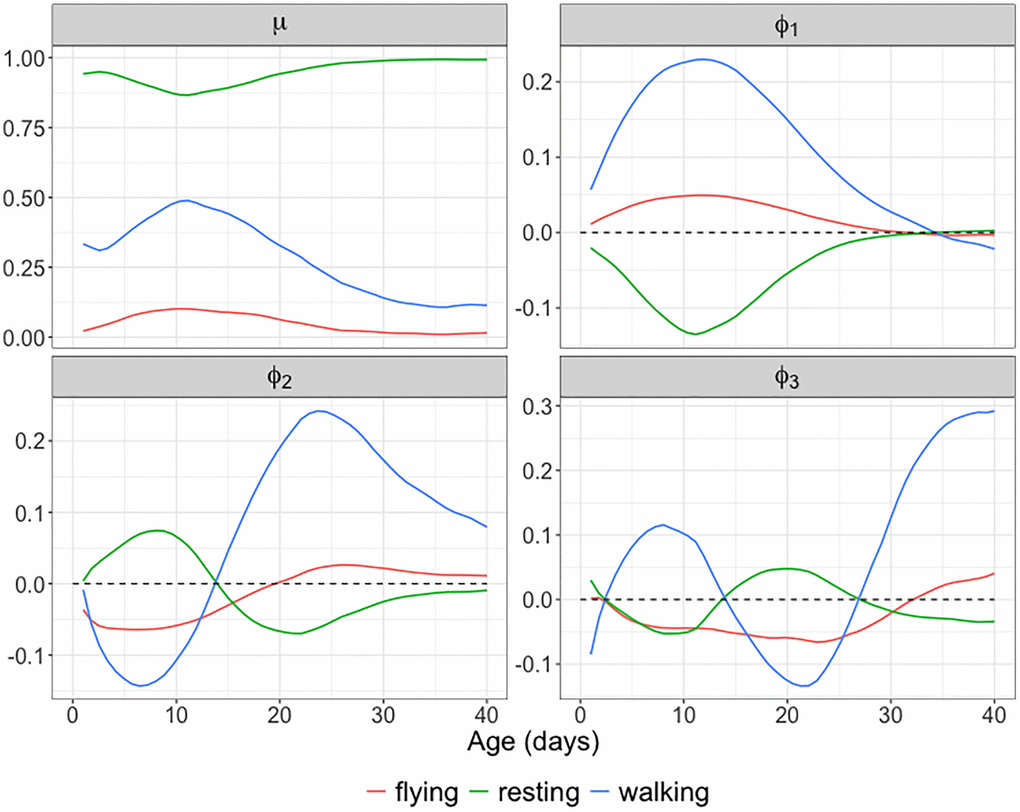
Figure 9.Mean function and eigenfunctions for longitudinal behavioral data. The estimated mean function and the first three estimated spherical eigenfunctions for the behavioral fly data using spherical functional principal component analysis. The first three eigenfunctions explain 96.54% of the total variation, with the individual components explaining 80.55%, 12.23% and 3.76%, respectively.