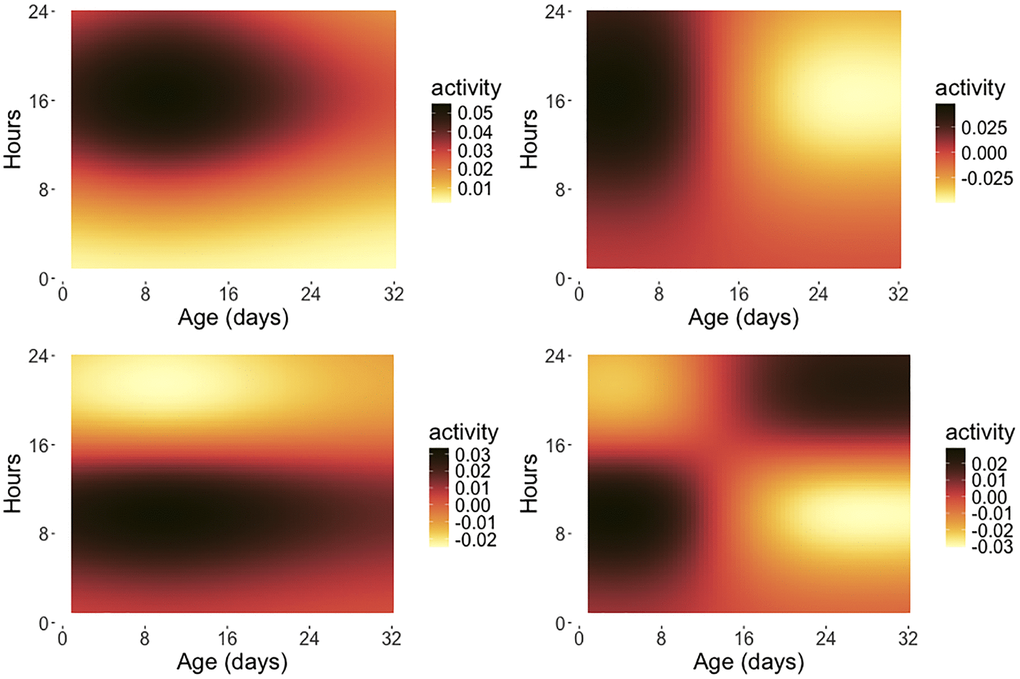
Figure 4.Eigensurfaces for early age medfly activity data. The first four eigensurfaces for product functional principal component analysis are depicted, with ϕ1(t)ψ1(s) (top left, 13.62%), ϕ2(t)ψ1(s) (top right, 8.62%), ϕ1(t)ψ2(s) (bottom left, 3.65%) and ϕ2(t)ψ2(s) (bottom right, 1.50%) as per (5), where the percentages represent the fraction of variance explained by the respective eigensurface and the ϕj are the eigenfunctions reflecting the variation over the age span in days while the ψk are the eigenfunctions for the intra-day variation. The x-axis indicates the age coordinate t (measured in days) and the y-axis represents the hour coordinate s within a given day (0–24 hours). Only flies surviving 32 days are included in this analysis.