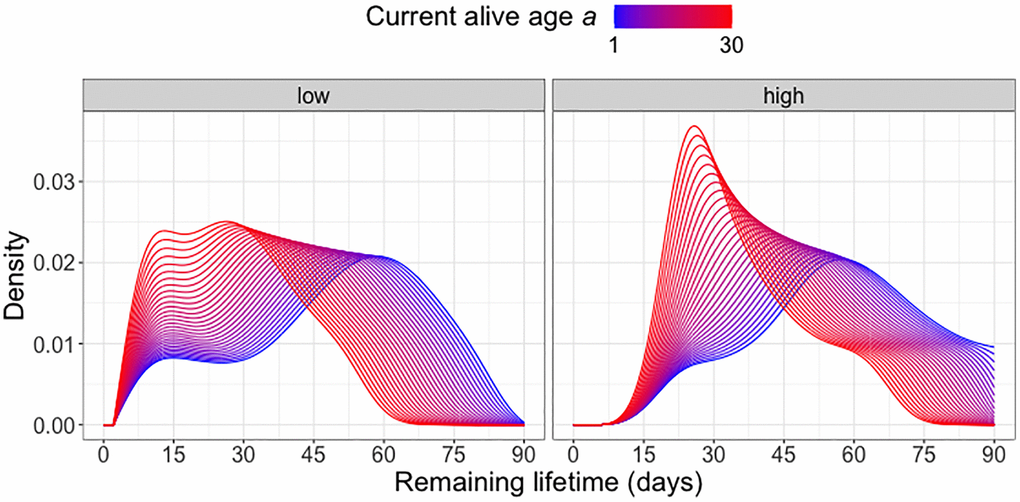
Figure 3.Remaining lifetime distribution for different activity levels. Predicted remaining lifetime distributions (visualized as densities) at varying alive ages a at which a subject is still alive and low (below median)/high (above median) activity levels, using global Fréchet regression (see (4) in the Appendix). Only C20-fed (yeast hydrolysate content 20%) flies are included in the analysis.