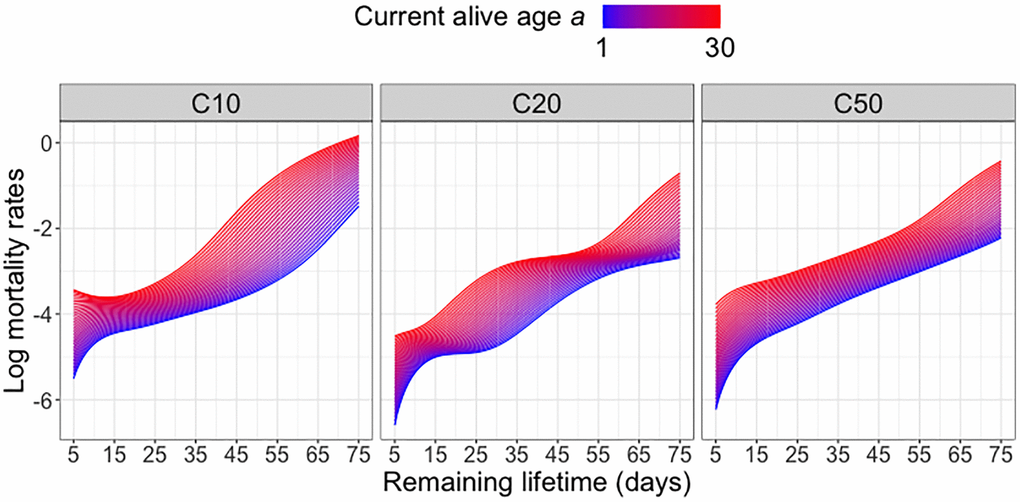
Figure 2.Log mortality rates for different diet groups. Log mortality rates (log hazard functions) of predicted remaining lifetime distributions across varying current alive ages a at which a subject is still alive for different diet groups; see equation (4) in the Appendix.