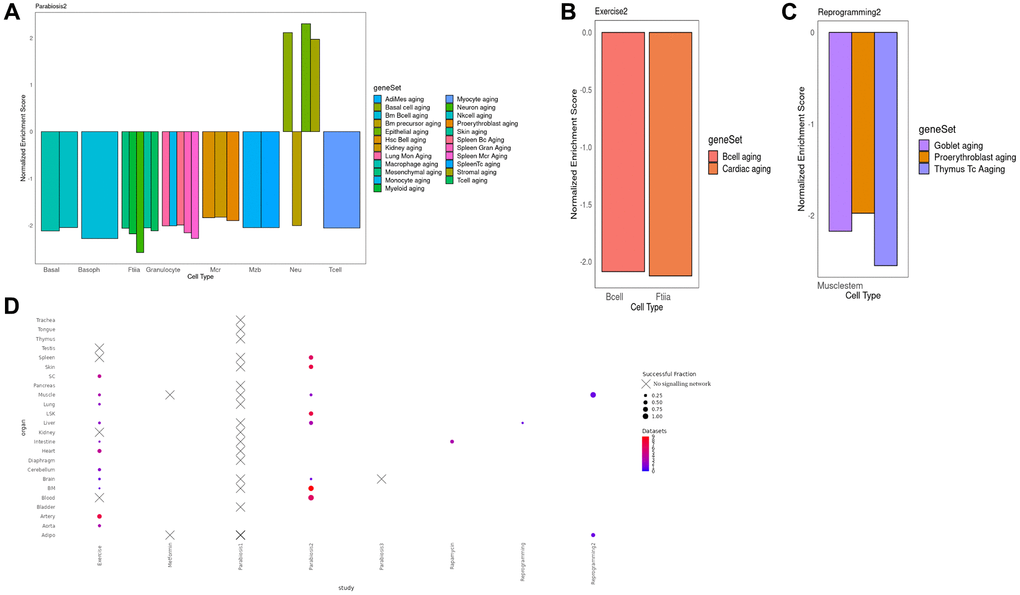
Figure 3. (A) Normalized enrichment scores for different cell types in different organs in the Parabiosis2 dataset. We observe substantial heterogeneity, including situations where a cell is negatively enriched both for its actual cell type and for the aging signature of other, very different lineages. This suggests that Parabiosis may be the most comprehensive rejuvenation intervention at this level of analysis. It must be noted that Neutrophils were the only cell type with a mixed rejuvenating and aging signature, but this is consistent with known responses to heterochronic parabiosis experiments. (B) Normalized enrichment score for the shared component between the TRN and the signaling network for Muscle fiber and Lung B cells under the Exercise condition. In this example, the geneSet cell markers for an aged transcriptome perfectly match the celltype the multi-modal network was derived from. (C) Normalized enrichment score for the shared component between the TRN and the signaling network in Reprogramming dataset for Muscle stem cells. In this example, the negative aging signature is found for three different cell types, none matching the one the data was derived from. (D) Bubble plot illustrating the number of cell types per organ and the fraction of cell types per organ where we were able to detect a sustained signalling network associated with the rejuvenation condition, per organ and study. Crosses indicate absence for any cell type. Full equivalence between the geneSet legend labels and the Tabula Muris Senis enrichments can be found in Supplementary Table 2.