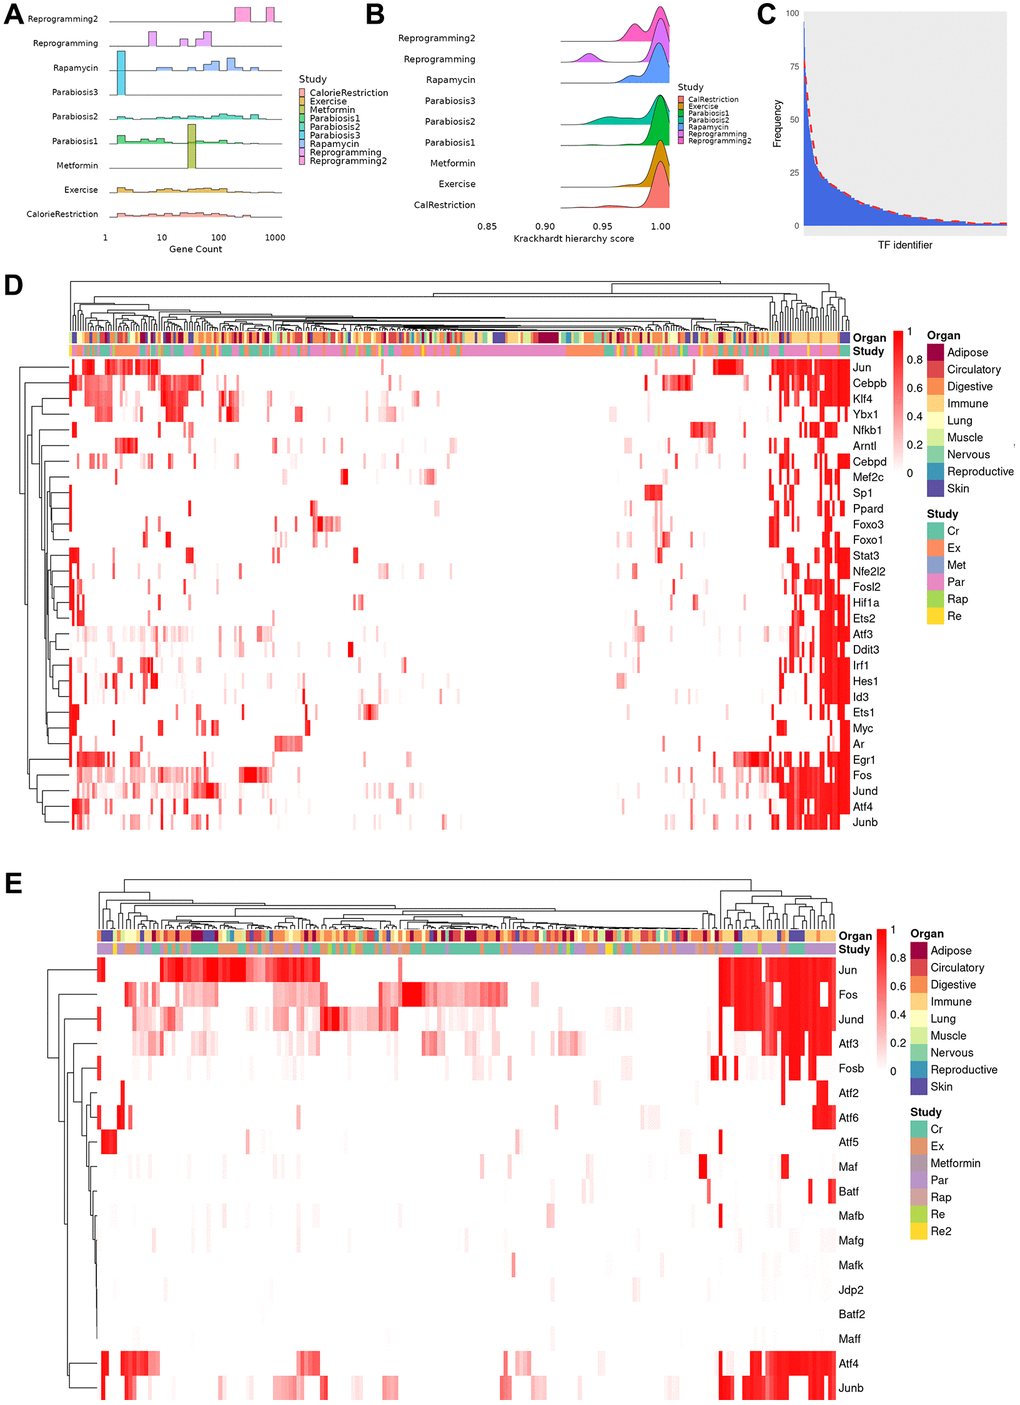
Figure 2.Properties and clustering of master regulators in the rejuvenation response. (A) Ridge plot of network size, calculated as sum of unique TFs and targets for each regulatory gene network, grouped by study (bin size = 30, average number of genes 72, median number of genes 31, range 2–867). Provided enough distinct regulatory networks are observed, their number of elements can vary between organs and cell types of the same dataset. (B) Krackhardt hierarchy scores of all TRNs. In this case, we universally see values very close to 1 (mean 0.994, rage 0.932–1), indicating a very hierarchical regulatory response for all rejuvenation interventions. This motivated the search for master regulators in the transcriptional networks. (C) Distribution of instances of a specific TF being observed in each of the TRNs. The majority of TFs are seen in only a few regulatory networks, but a minority appear in a significant fraction. (D) Heatmap of the TF score (see online methods) for the 30 TFs with the greatest average ranking across all TRNs. Clustering was performed with the manhattan distance and the McQuitty method. Coordinated TF responses can be observed, as well as activity patterns strongly associated more with the rejuvenation condition than the cell type, potentially uncovering more holistic rejuvenation interventions by targeting master regulators behind different interventions. (E) Heatmap subset transcription factors known to be part of the AP-1 complex. Several clusters that contain a single master regulator can be observed in the differential rejuvenation response. Given these cofactors are expected to be coexpressed, this suggests a rejuvenation response in immune cell types under Calorie Restriction and Parabiosis that relies on the action of distinct AP-1 dimers.