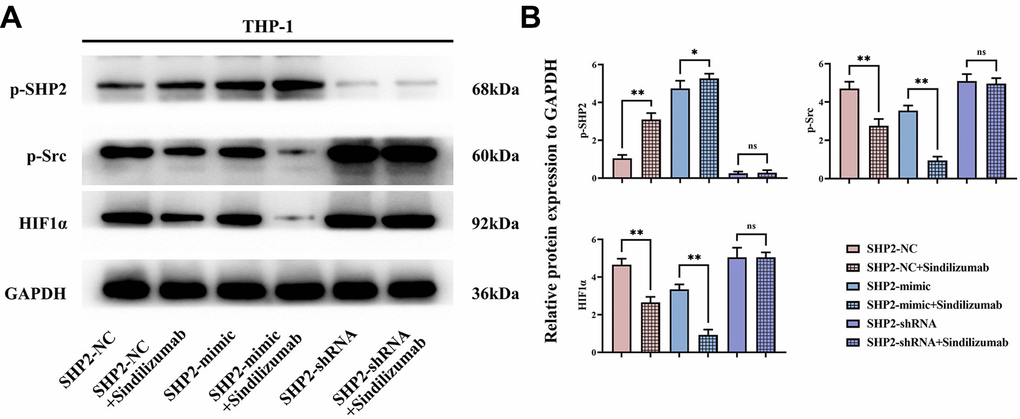
Figure 4.Impact of PD-1 monoclonal antibodies in TAMs on the SHP2/Src signaling pathway. (A) Western blot bands of p-SHP2, p-Src, and HIF1α; (B) statistical analysis of the relative protein expression levels of p-SHP2, p-Src, and HIF1α. GAPDH as a control protein. Data were expressed as mean±SD. *P<0.05; nsP>0.05.