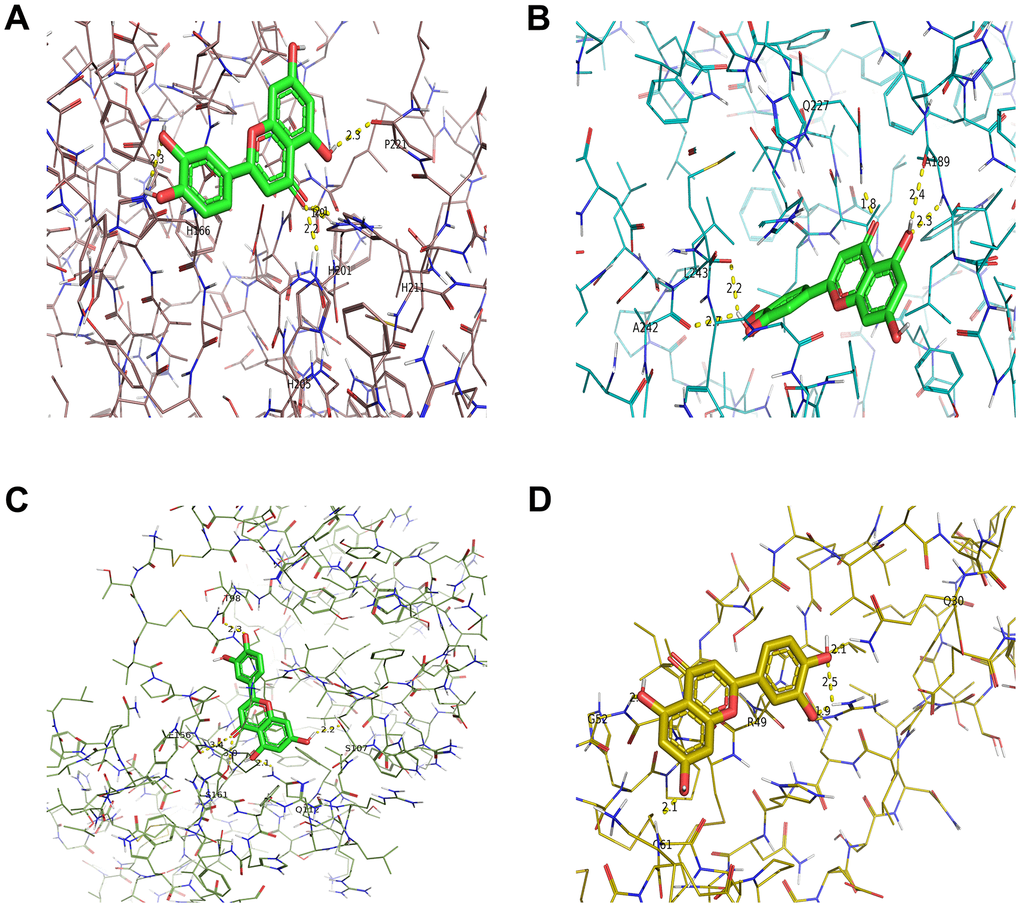
Figure 6.Molecular models of luteolin binding to its predicted protein targets. 3D receptor-ligand interaction diagram for the top four genes with the lowest binding energy for MMP3 (A), MMP9 (B), TIMP1 (C), VEGFA (D).
Figure 6 — Elucidation of the anti-colorectal cancer mechanism of Atractylodes lancea by network pharmacology and experimental verification | Aging