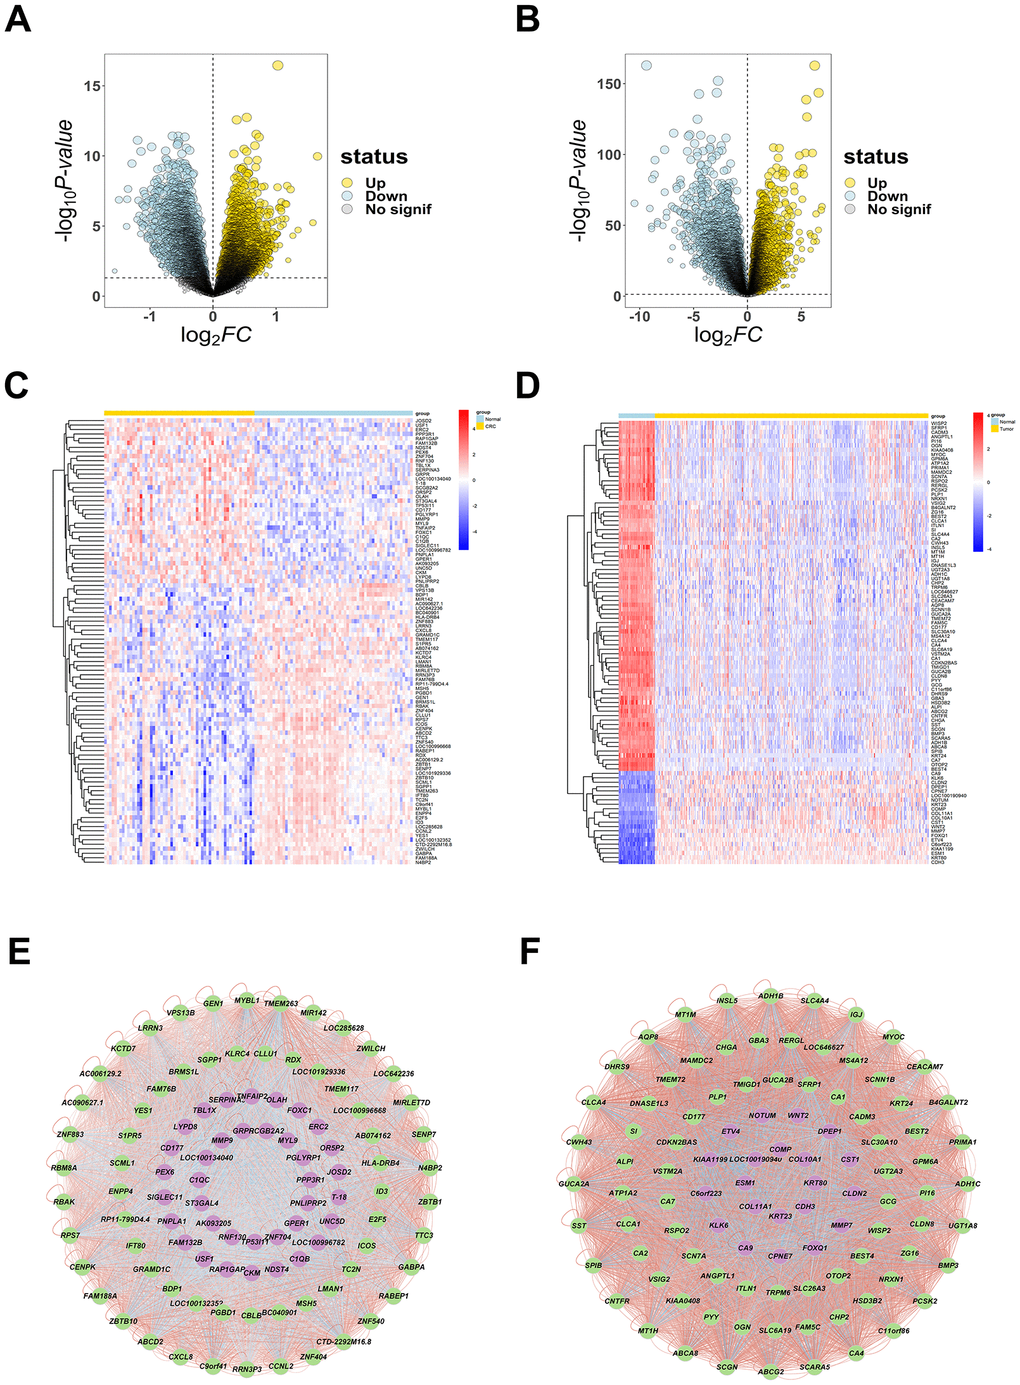
Figure 1.The DEGs of CRC. (A, B) The volcano plots were created to visualize differentially up- and down- regulated genes from GSE164191 and TCGA with significance p < 0.05, reseparate, up-regulated genes are shown in yellow color, down-regulated genes are shown in light blue color. (C, D) The heatmaps were to show the top 100 up- and down-expressed genes, up-regulated genes are shown in red color, down-regulated genes are shown in blue color. (E, F) Network diagram (arranged according to LogFC value) of top 100 DEGs were plotted to evaluate their correlation ship, up-regulated genes are shown in purple color, down-regulated genes are shown in green color, significant negative correlation ship are shown in blue lines, significant positive correlation ship are shown in red lines.