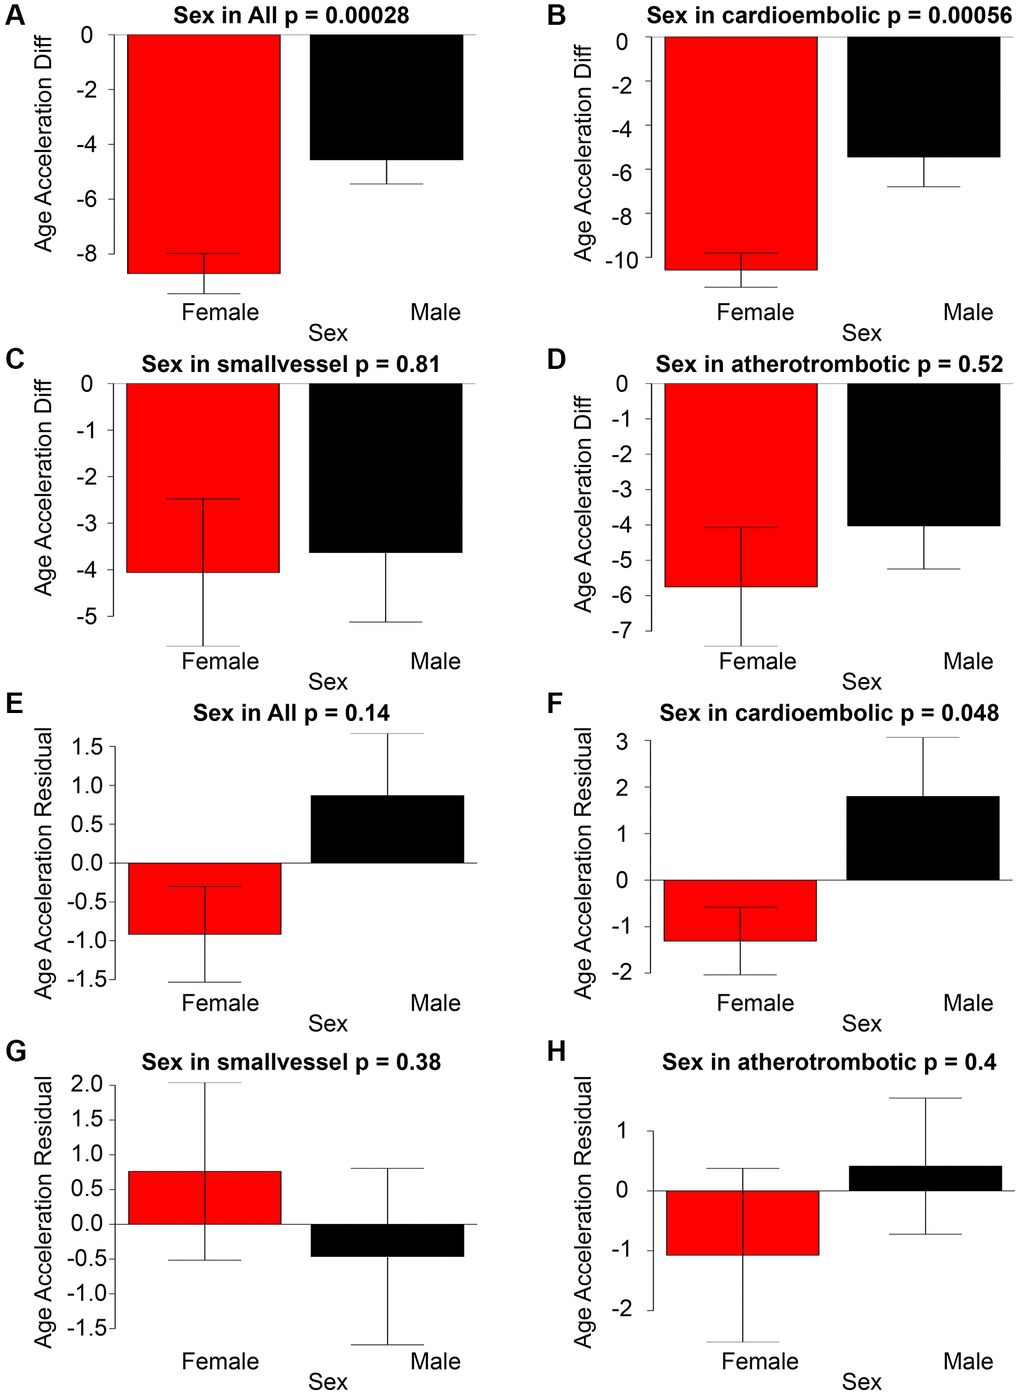
Figure 2.The graphical representation of Age Acceleration Diff (y-axis) in correlation with Sex for All stroke, cardioembolic stroke, small-vessel stroke, and atherothrombotic stroke can be observed in panels (A–D). Panels (E–H) illustrate the associations between Age Acceleration Residual (depicted on the y-axis) and Sex across All stroke, cardioembolic stroke, small-vessel stroke, and atherothrombotic stroke.