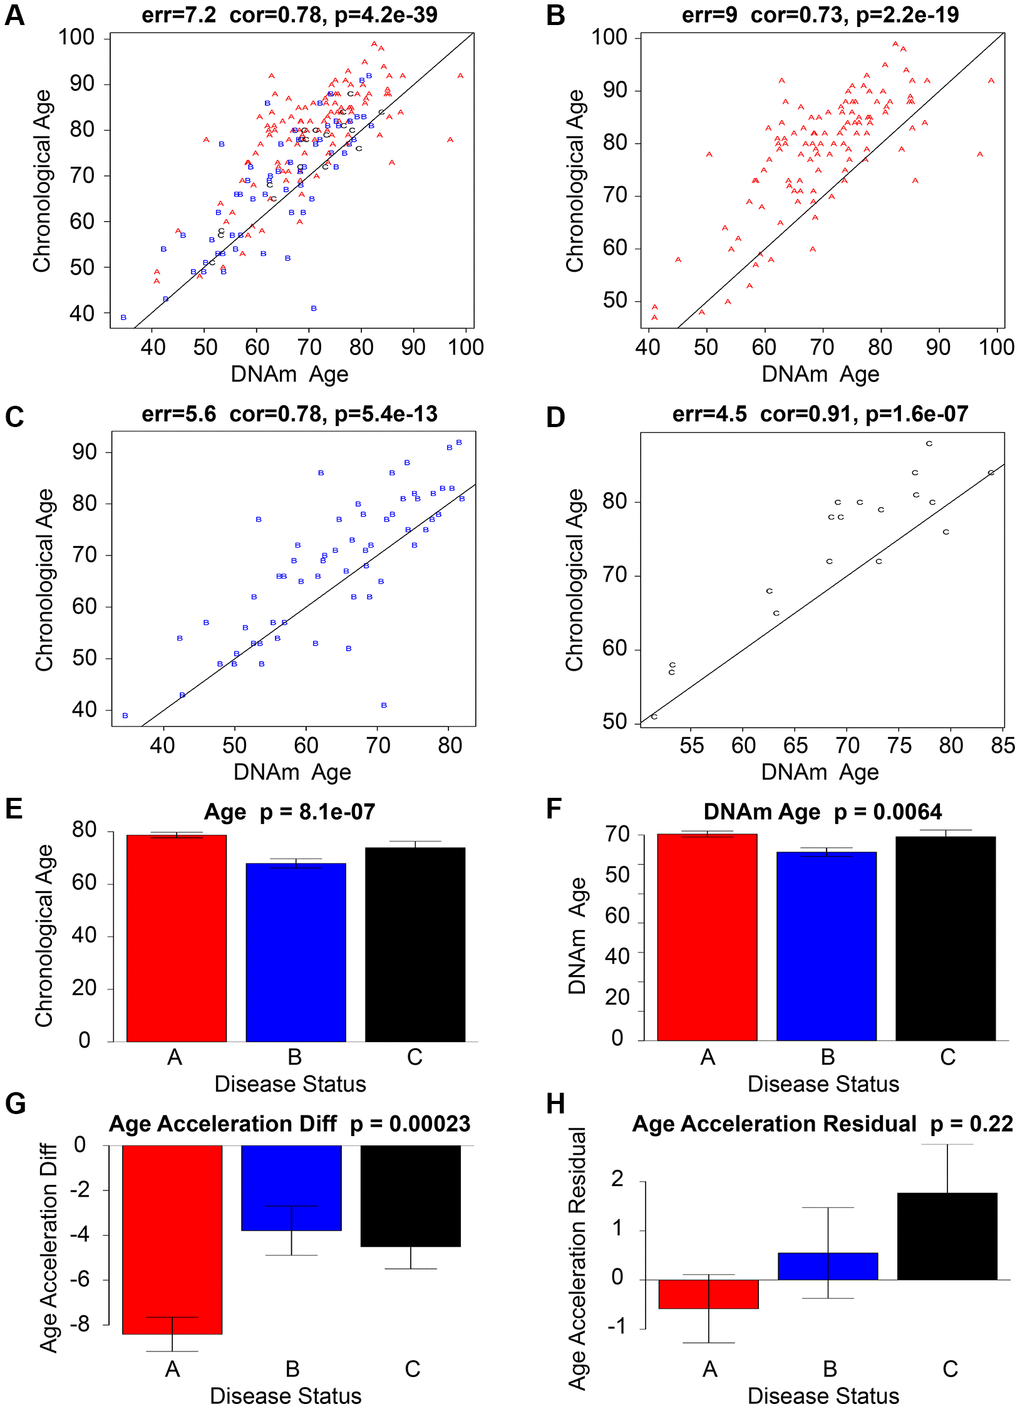
Figure 1.An analysis of a data set pertaining to ischemic stroke. The scatter graphs presented in the top row (A–D) of the Ischemic stroke data sets depict the relationship between DNAm age (x-axis) and chronological age (y-axis). A represents a cardioembolic stroke and is colored red, B represents a small-vessel stroke and is colored blue, while C represents an atherothrombotic stroke and is colored black. The line of regression through IS is represented by the black line. The vertical distance to the black regression line corresponds to the effect of age acceleration for each subject. Although there is a strong correlation between chronological age and DNAm age, it has been observed that Red, Blue, and Black Alphabet tend to exhibit accelerated aging effects as they lie above the black line. The lowermost tier (E–H) depicts the correlation among chronological age, DNAm age, Age Acceleration Diff, Age Acceleration Residual, and the presence or absence of Ischemic Stroke Disease. The bar graphs’ titles comprise the P-value obtained from a nonparametric group comparison test, specifically the Kruskal-Wallis test.