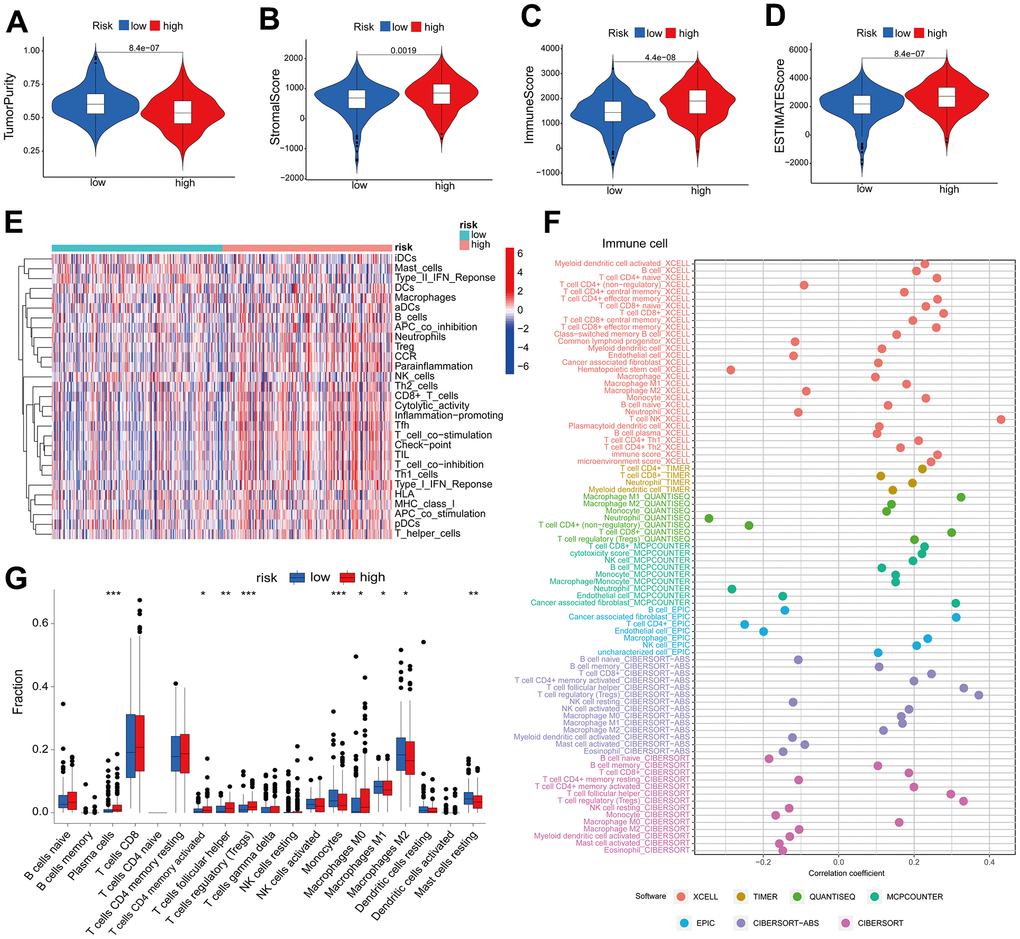
Figure 3.High risk score suggests high immune infiltration. Relationship between risk scores and tumor purity (A), stroma score (B), immune score (C), and ESTIMATE score (D). (E) Heatmap of the abundance of immune cells in the high-risk and low-risk groups. (F) Risk score and immune cell correlation. Different colors represent different algorithms. (G) Proportion of immune cells in the high-risk and low-risk groups. *p < 0.05, **p < 0.01, ***p < 0.001.