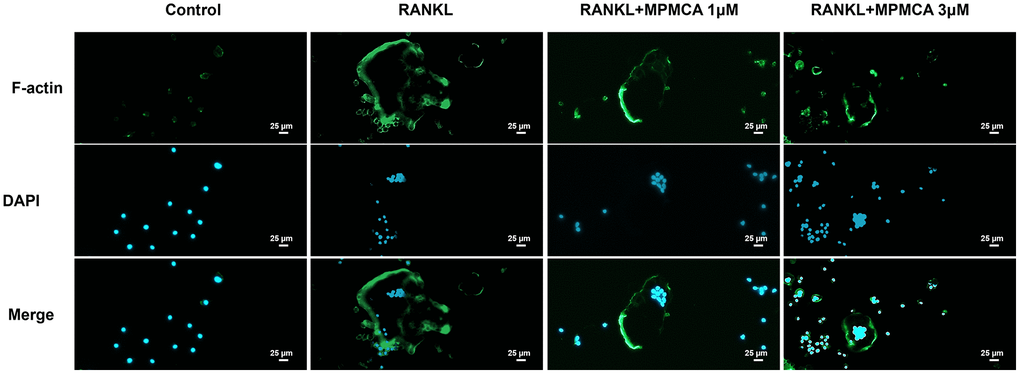
Figure 2.MPMCA inhibits RANKL-induced F-actin expression. The RAW 264.7 cells were exposed to RANKL and MPMCA at doses of 1 μM and 3 μM respectively, for a period of 7 days (n = 3). The F-actin is represented by green, whilst the nuclei are stained with DAPI and presented in blue.