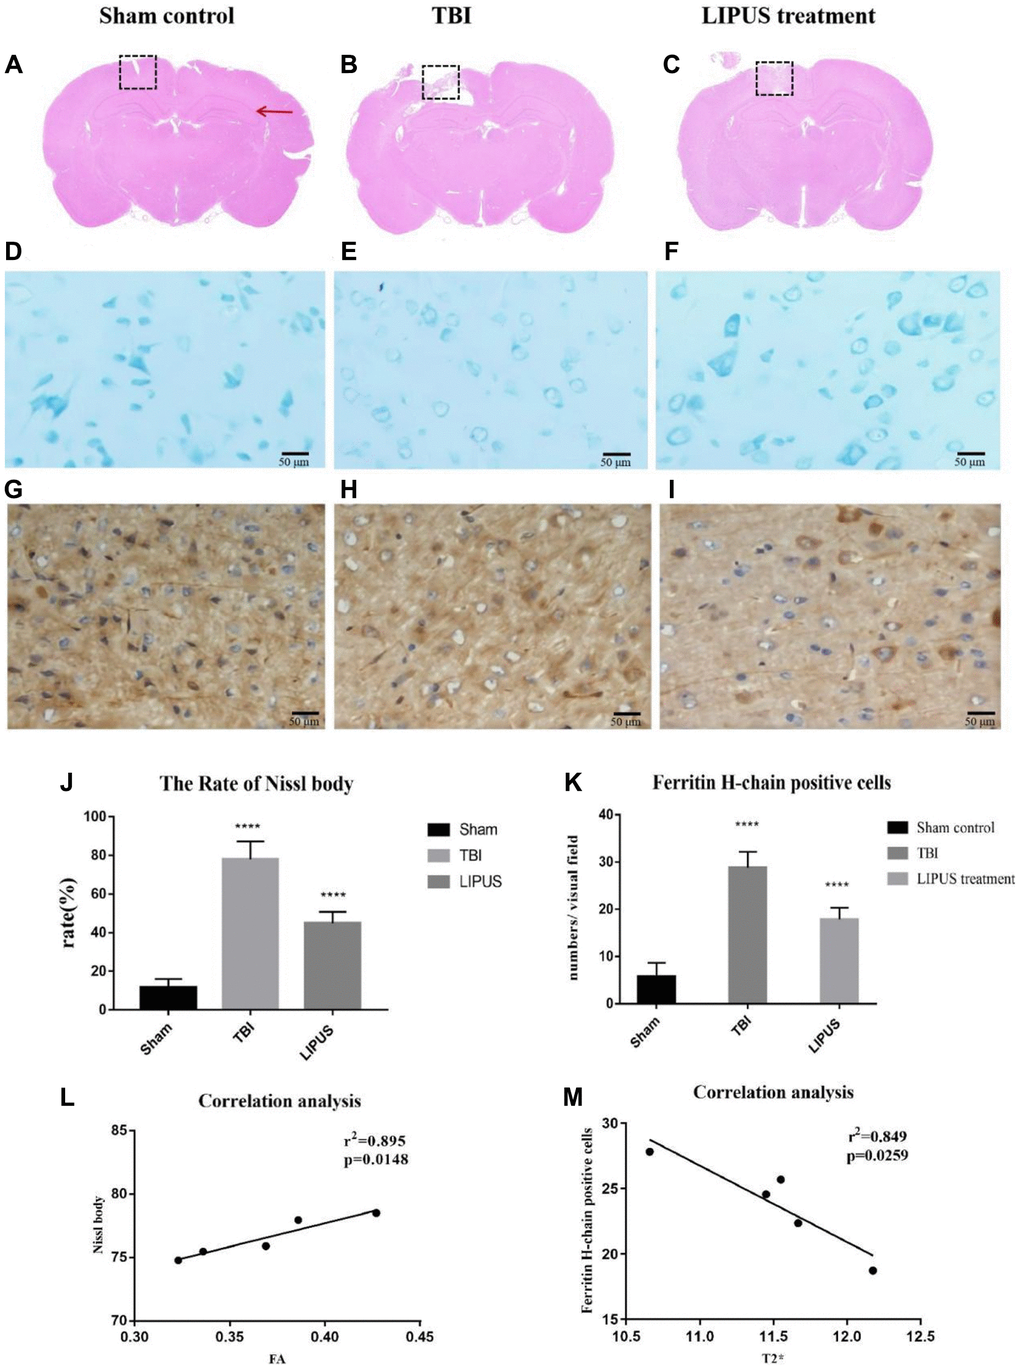
Figure 2.(A–C) Representative HE staining images of different groups are shown. The red arrows indicate the location of the hippocampus, and the dashed boxes represent the site of cortical injury on the right side. It can be observed that there was significant cavity formation in the TBI group, and the cavity area decreased after LIPUS treatment. (D–F) Histopathology of Nissl staining. Compared with the Sham control group, the neurons in the TBI group showed obvious edema, fewer cells, sparse arrangement, reduced Nissl bodies in the cytoplasm, and some cells were stained light blue. In the LIPUS treatment group, the nerve cells in the injured area were arranged densely and neatly, and the Nissl bodies were abundant in the cytoplasm. The Nissl corpuscles in the cerebral cortex were dark blue, the nucleus was light blue, and the background was light blue. Bar, 50 μm. (G–I) Immunohistochemical staining of Ferritin-H-chain in the ipsilateral cortex 7th day after TBI. Brown cells represented positive for ferritin-H-chain, which were mainly located in neuron-like cells and occasionally in glia-like cells. The number of positive cells in TBI group and LIPUS group was significantly higher than that in Sham group. Obvious brown staining was observed in the cytoplasm in TBI group, and the staining in LIPUS group was lighter than that in TBI group. (J) The rate of Nissl body in the LIPUS group was obviously lower than TBI group. (K) The number of positive cells in TBI group and LIPUS group was significantly higher than that in Sham group. (L, M) Correlation analysis. In the TBI group, FA values were positively correlated with neuronal damage and T2* values were negatively correlated with ferritin. Data are Mean ± SD. One way-ANOVA, ****P < 0.0001.