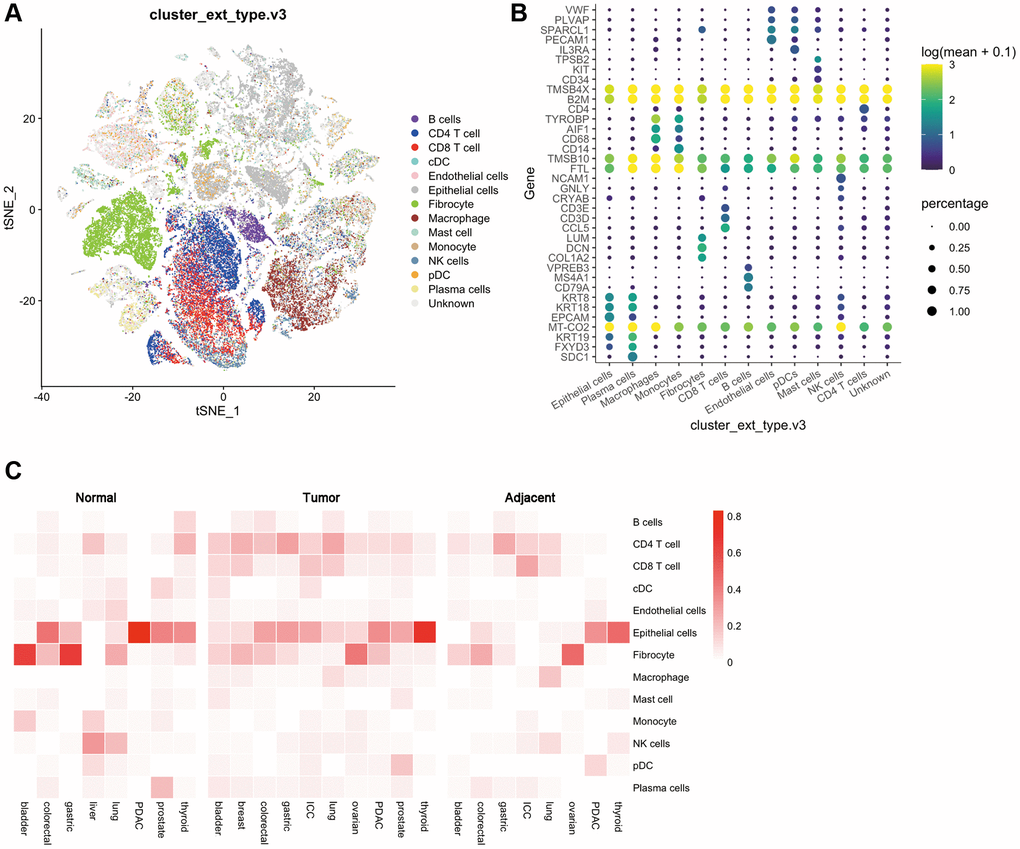
Figure 2.Distribution of various cells and immune checkpoints in the tumor immune microenvironment. (A) t-SNE plots of tumor-infiltrating T cells and stromal cells, overlaid with color-coded clusters; (B) The expression of immune genes in different types of immune cells. The size of the dots represents the proportion of cells with positive gene expression, and the color represents the level of gene expression; (C) Heat map of the distribution ratio of cells in the immune microenvironment in normal tissues, adjacent tissues, and tumor tissues of a variety of tumors.