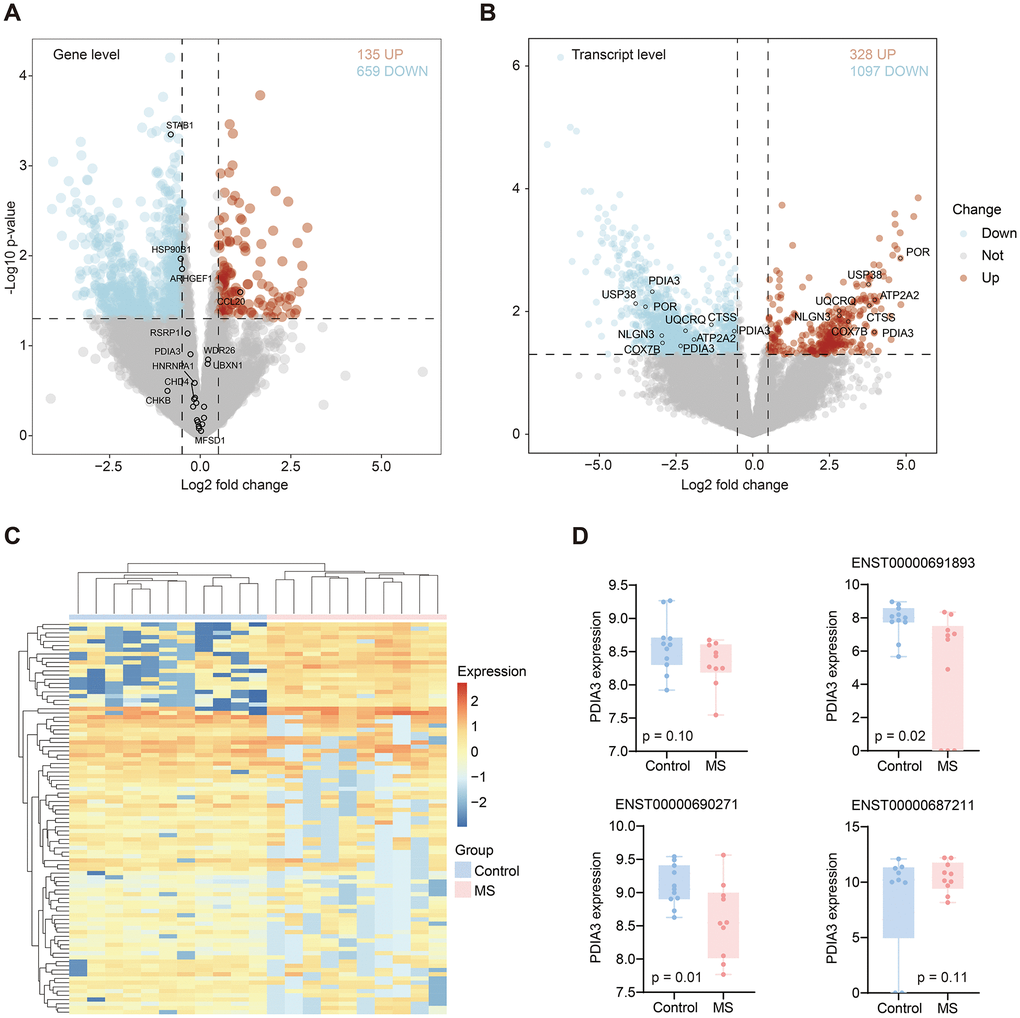
Figure 5.Differentially expressed genes and transcripts. (A) Differential genes volcano in MS compared with control group. Red and blue dots represent up and down-regulated genes, respectively. (B) Differential transcripts volcano in MS compared with control group. Red and blue dots represent up and down-regulated transcripts, respectively. (C) Heatmap displayed significantly different transcripts expression in MS and control group. (D) Boxplots showed the PDIA3 gene and its three transcripts’ differential expression between MS and control groups.