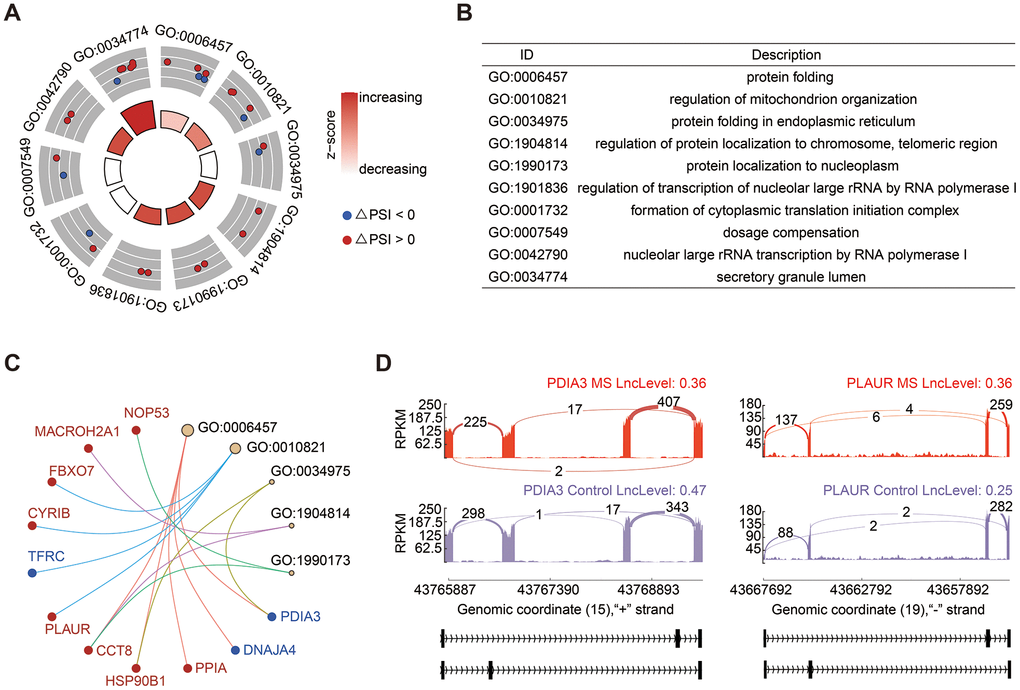
Figure 3.Analysis of MXE events. (A, B) GO enrichment analysis of genes involved in MXE events. (C) Cnetplot of genes in enriched GO terms. The PSI of PDIA3 was decreased and colored in blue, in contrast, PLAUR was colored in red. (D) Sashimi plots provided a detailed depiction of the alterations in transcripts of PDIA3 and PLAUR.