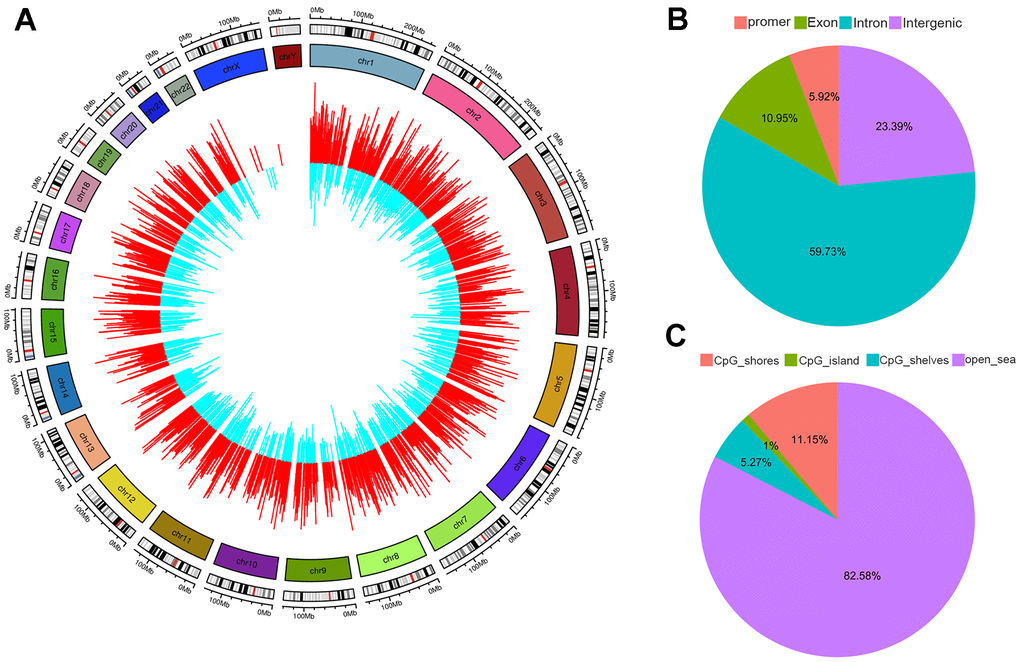
Figure 4.Distribution of differentially methylated CpGs (DMR). (A) Outer circle represents hypermethylated CpGs colored in red. Inner circle represents hypomethylated CpGs colored in blue. The height of each bar indicates the methylation change between thalassemia and normal. The distributions of DMR summarized based on genomic location (B) and relative to CpG islands (CpGi) (C).