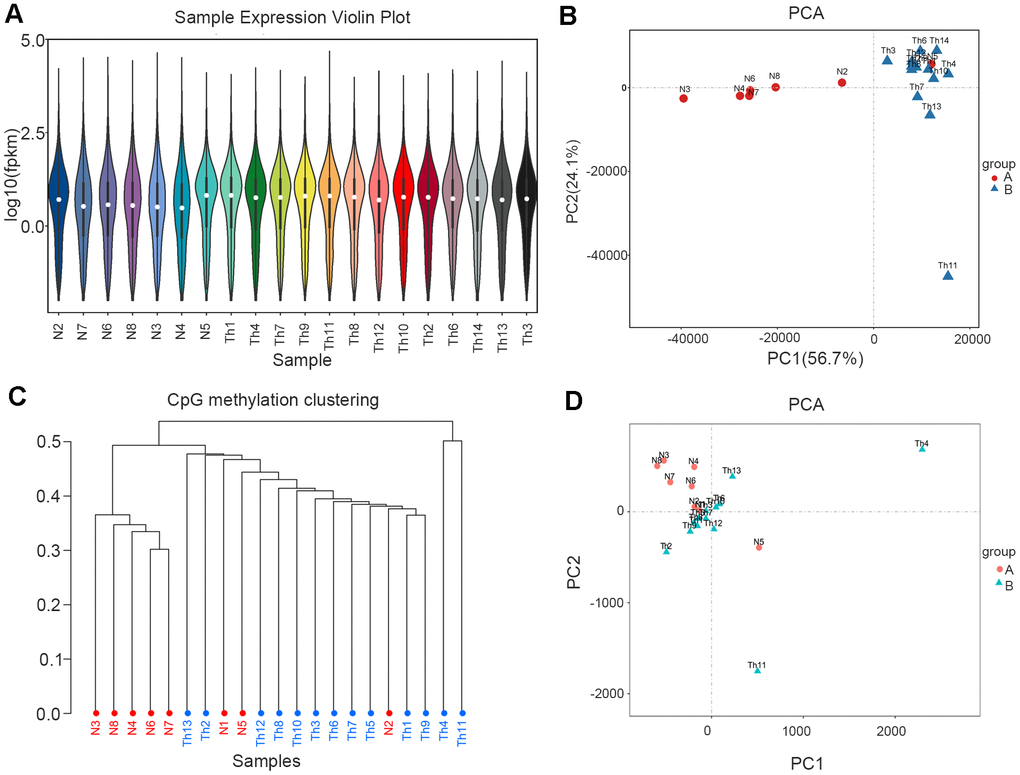
Figure 1.RNA-seq and WGBS data cluster analysis. (A) Sample expression violin plot. White dot represents the median Q2. The black rectangle represents the range from the lower quartile to the upper quartile. (B) Principal Component Analysis. Red dots represent normal. Blue dots represent thalassemia. (C) Principal Component Analysis (WGBS). Red dots represent normal. Blue dots represent thalassemia. (D) CpG methylation clustering. Red represents normal. Blue represents thalassemia.