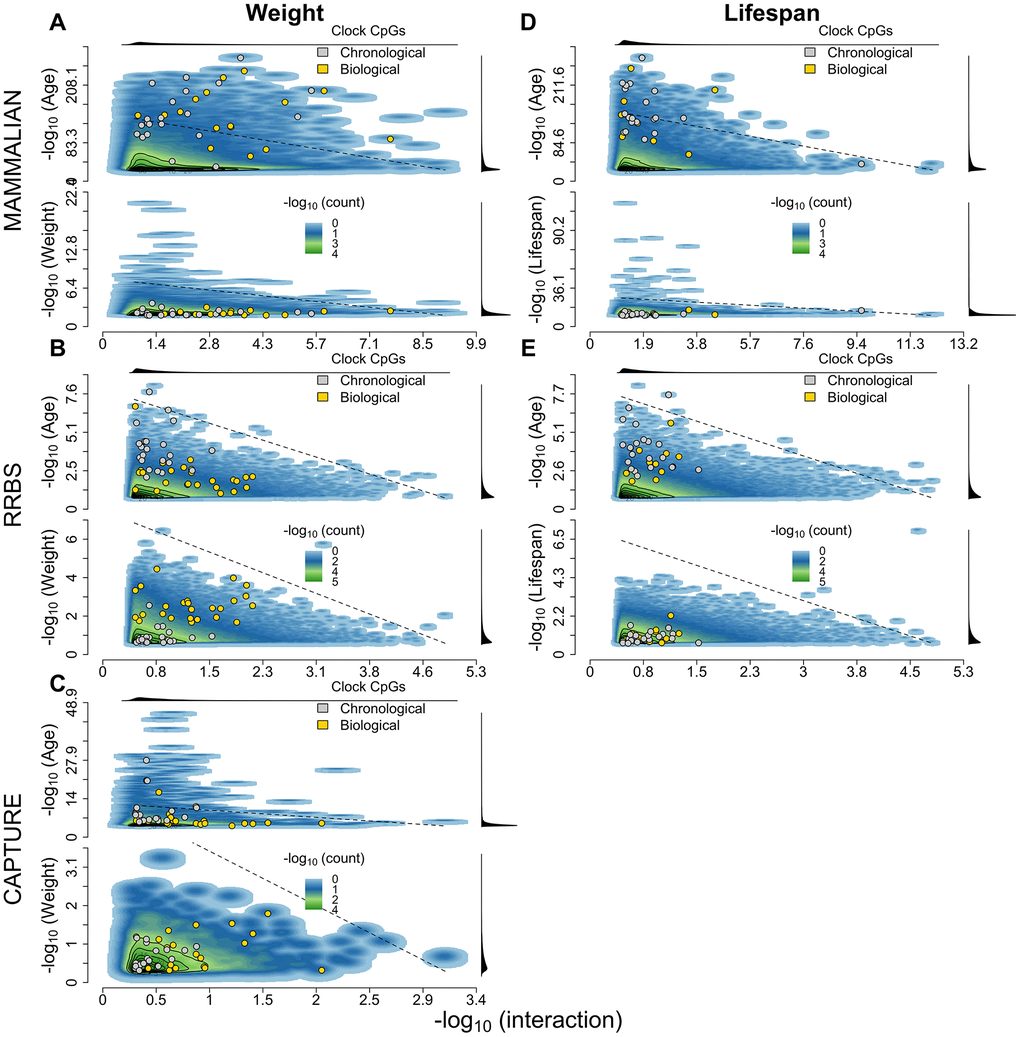
Figure 5.2D density distribution of biological age EWAS p-values. (A–E) The top panel corresponds to the mammalian methylation array, the center panel to the capture sequencing and the bottom panel to the RRBS dataset. The x-axis shows the likelihood improvement of the nested model containing age, the moderator variable and the age-moderator interaction against the model containing only chronological age, both with phylogenetically corrected errors. Panels (A–C) use weight as the moderator variable while (D–E) use lifespan. The top and bottom y-axes in each panel correspond to the p-values for age and for the moderator variable with phylogenetically corrected errors, respectively. The marginal densities of each p-value distribution are plotted in the top and right margins of each plot. The sites that contribute to the penalized regression chronological (gray) and biological age (yellow) clocks are annotated within each plot. The dotted lines correspond to linear combinations of -log p-values corrected for inflation (i.e., median of empirical p-value distribution divided by median of uniform distribution [~0.5]).