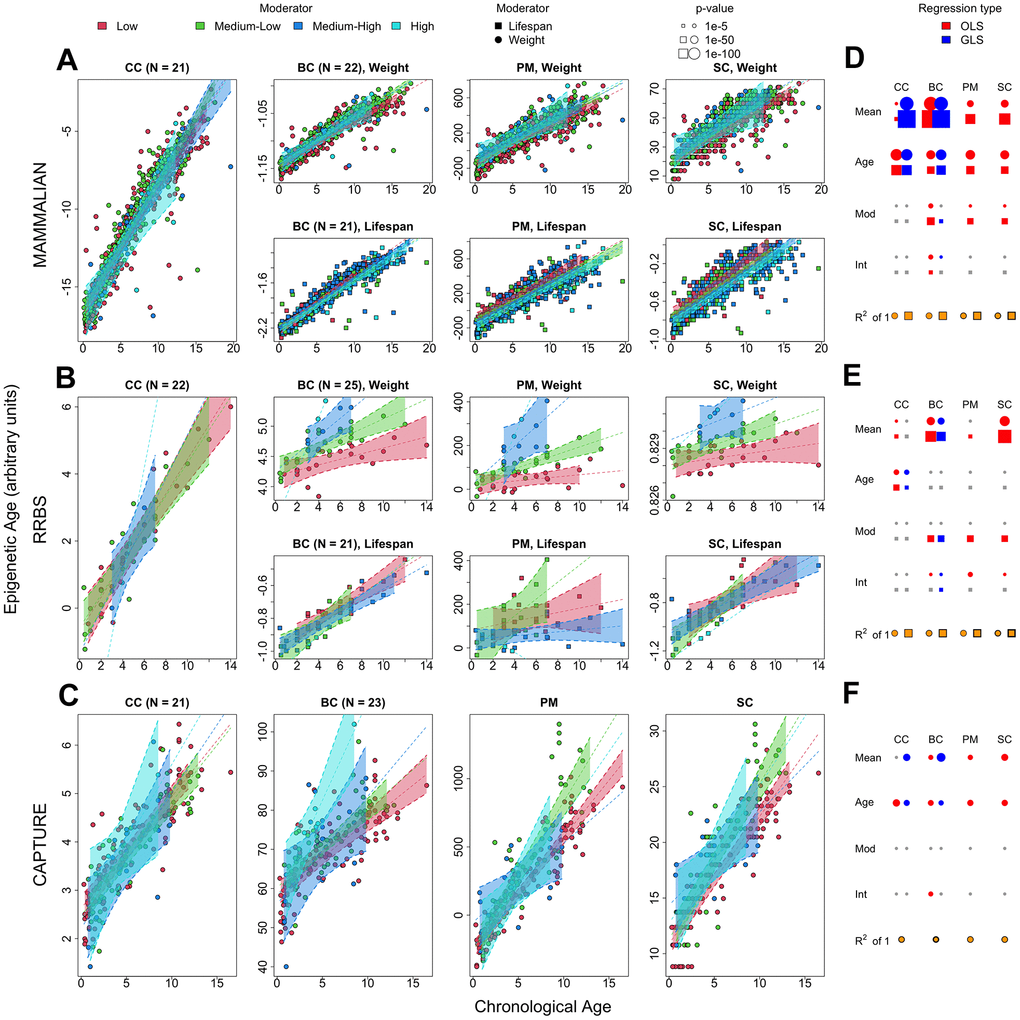
Figure 4.Statistical analyses of chronological and biological age sparse epigenetic clocks using phylogenetic penalized regression. Rows correspond to the mammalian methylation array, RRBS, and capture sequencing datasets, respectively. (A–C) The first, second, third and fourth panels in each row represent the different epigenetic clocks. CC: penalized generalized least squares regression trained on chronological age. BC: penalized generalized least squares regression trained on biological age (product of age and weight), PM: epigenetic pacemaker trained on biological age data, SC: BayesAge algorithm trained on biological age data. The trend lines and 99% confidence intervals are derived from the penalized, phylogenetic least squares prediction model. Any split panels depict the use of weight or lifespan as a moderator as described in the panel and legend. (D–F) The rightmost plots of each row depict the significance of each regressor in the corresponding dataset, with circle radii proportional to -log p-value (blue: phylogeny corrected least squares, red: ordinary least squares, gray: non-significant), the yellow-colored fraction of the area of the bottom circles and squares depicts the regression R2 values derived from the penalized, phylogenetic least squares prediction model.