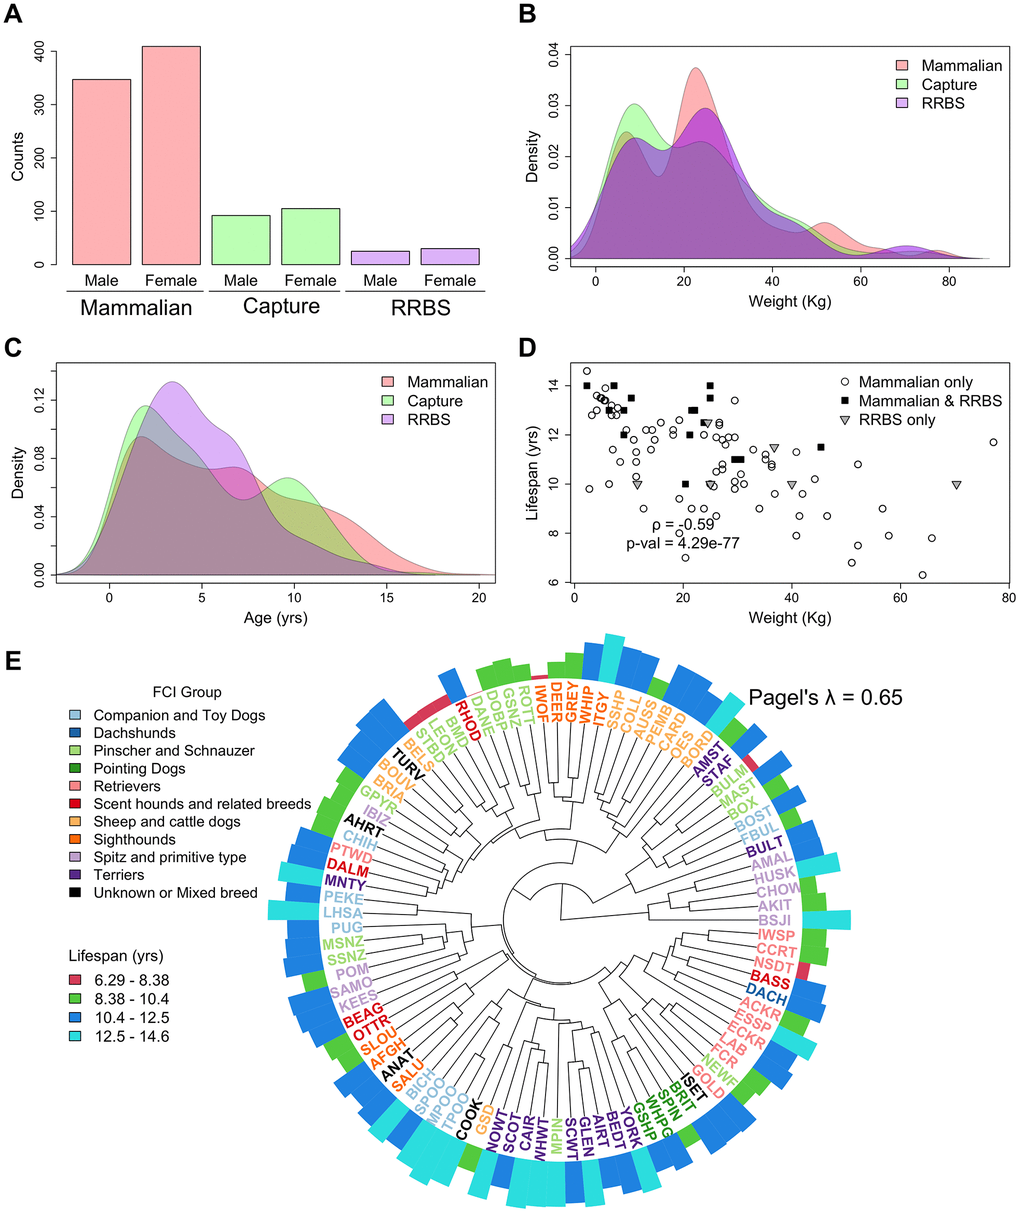
Figure 2.Summary of the relevant phenotypes across the RRBS, mammalian methylation array and capture sequencing datasets. (A–C) Distribution of sex, weight, and age in the three datasets. (D) Correlation between lifespan and weight in all breeds represented in the three studies. Capture sequencing contained a subset of the breeds represented in the mammalian methylation array. (E) Canonical phylogeny of the breeds represented in all three studies [20]. The length of the outer ring bars is proportional to lifespan and colored according to a binning of the lifespan distribution in equal length intervals. The tree tips are colored according to the Fédération Cynologique Internationale [35] (FCI) group and named after the convention in Parker et al. [20].