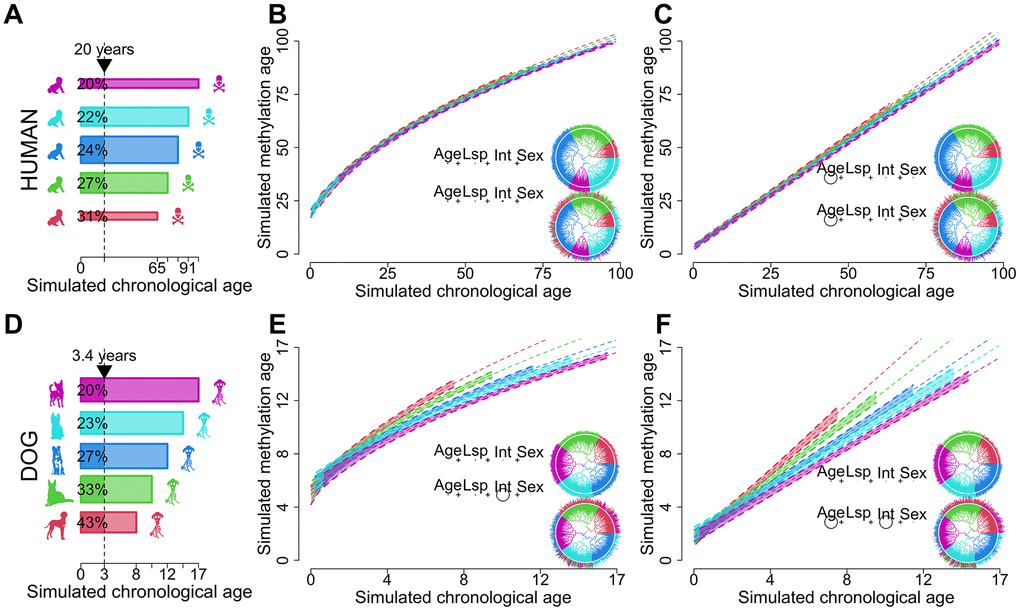
Figure 1.Schematic showcasing the potential of dogs as models for biological aging. Humans (A–C) are compared to dogs (D–F). Panels (A, D) represent idealized distributions of longevity. Human longevity (A) is centered around a particular value while dogs with infrequent extremes as depicted by the width of the bars. Dog longevity (D) is more evenly distributed across different breeds. The different colors represent longevity bins. The vertical dotted line in (A, D) shows the variation in biological ages for a fixed chronological age. The longevity distributions in (A, D) were used to generate the biological age regression models in (B, C, E, F). Ages were sampled uniformly from within the bounds of each longevity category. Regression models contain a dependent term raised to the second power and simulated values for age (Age), lifespan (Lsp), sex (Sex) and the quotient between age and longevity representing biological age (Int) as independent variables. The same coefficients, sample sizes and error distributions were used for humans and dogs, and phylogenies were randomly generated. Panels (B, E) represent the effects of non-linearity while (C, F) depict the linearized regression model. The p-values of each regression term are shown as circles in the inscribed equations with size proportional to -log magnitude, joined by plus signs to evoke linear regression. In panels (B, C, E, F) the top equations showcase instances where longevity is completely correlated with tree topology, as depicted by the matching color of the tree leaves and edges. In the bottom equations longevity has a smaller phylogenetic signal while still retaining some phylogenetic structure. The 99% confidence intervals and trend lines in the plots are produced by this second model.