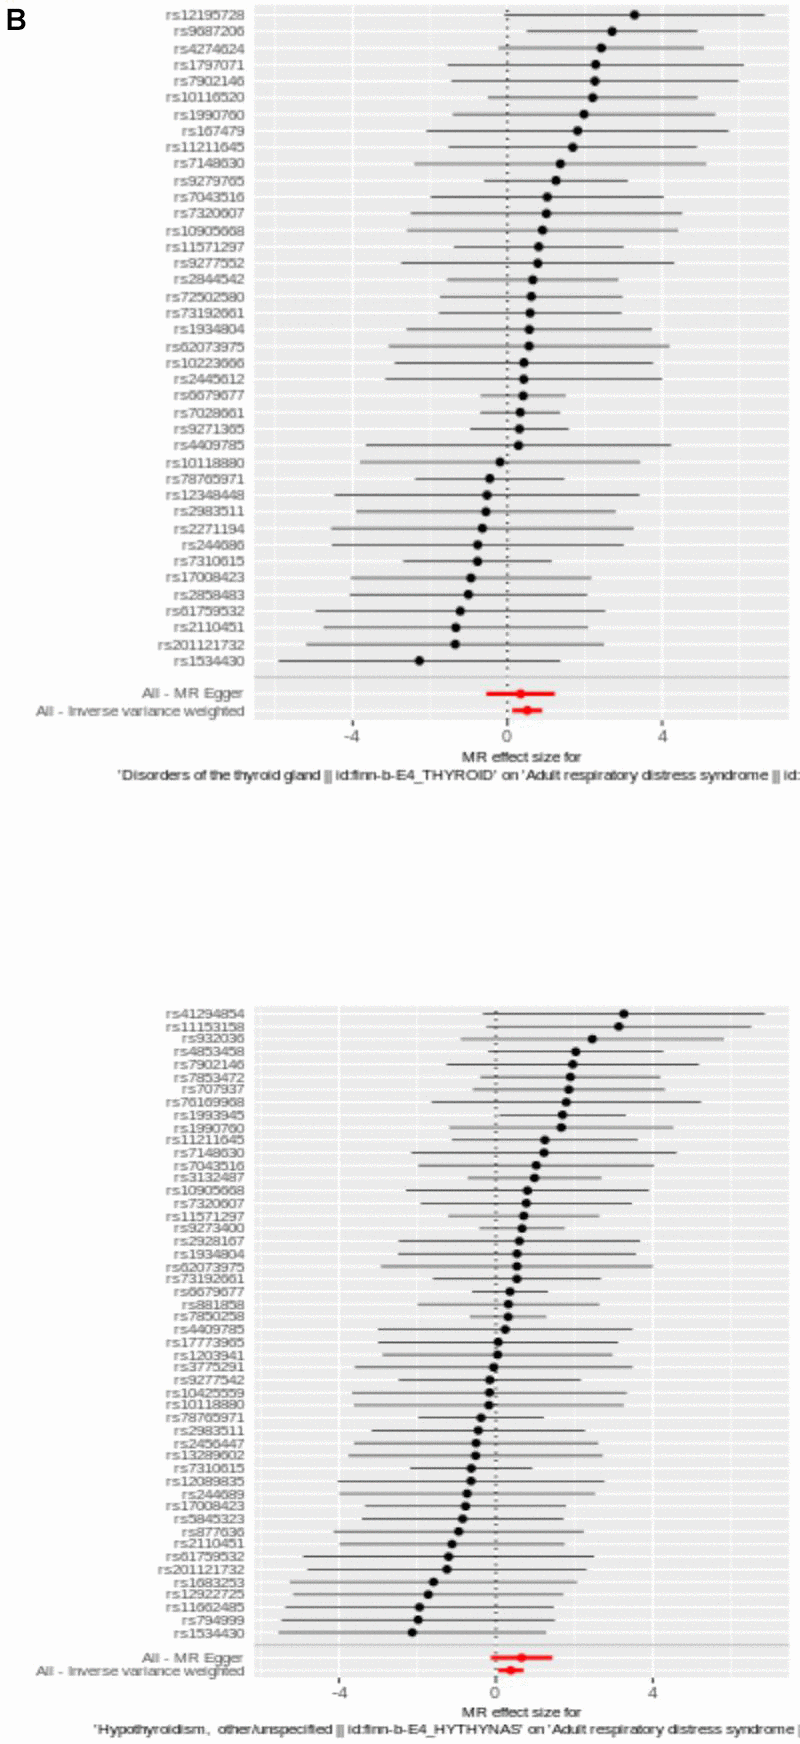
Figure 2.(B) The utilization of a funnel plot. The utilization of a funnel plot as a means to assess the robustness of a study is being considered. The dispersed data points represent the approximate impact of a solitary SNP employed as an IV. Global estimate was depicted by the vertical lines, which were obtained using IVW approach using MR-Egger regression.