Submit an Article
Navigate
Home
Editorial Board
Editorial Policies
Current Volume
Archive
Scientific Integrity
Publication Ethics Statements
Interviews with Outstanding Authors
Newsroom
Sponsored Conferences
Podcast
Contact
Special Collections
Submit an Article
Online ISSN: 1945-4589
Research Paper
|
Volume 16, Issue 13
|
pp. 11018–11026
Identification of
Escherichia coli
strains using MALDI-TOF MS combined with long short-term memory neural networks
Back to article
Figure 3
(3 of 4)
−
100%
+
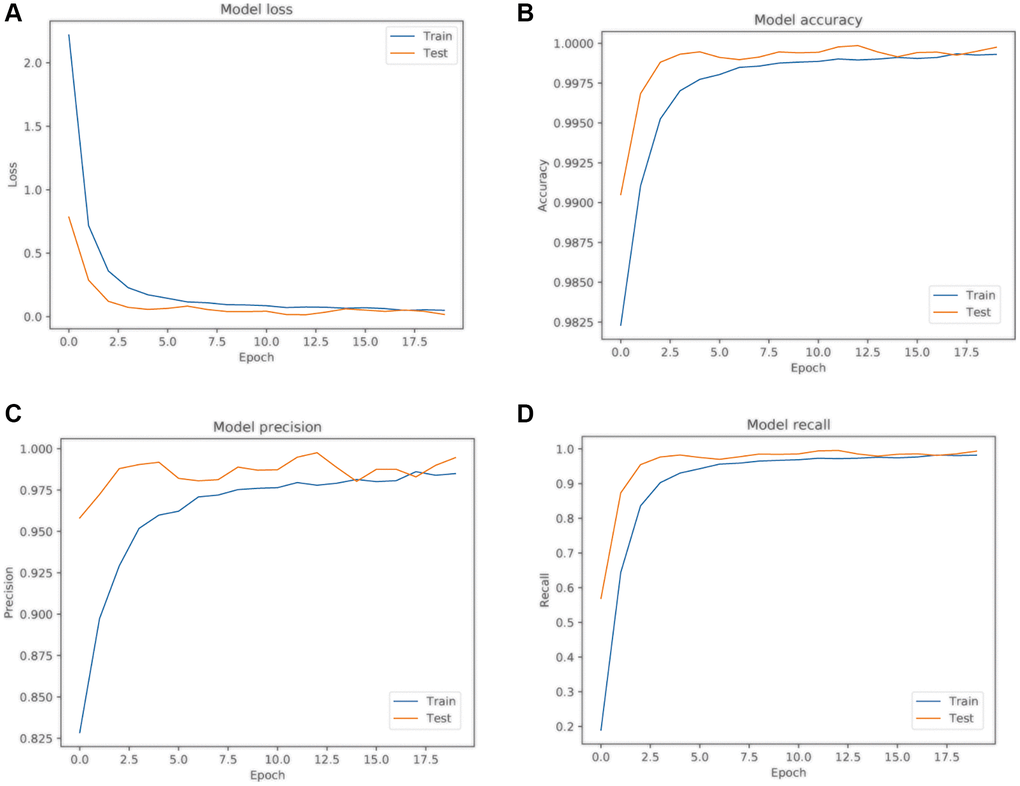
Figure 3.
LSTM model training results.
(
A
) Model loss curve; (
B
) Model accuracy curve; (
C
) Model precision curve; (
D
) Model recall curve. Blue represents the training sample curve, and yellow represents the test sample curve.